AWS, GCP, Azure Cost Comparison: Real Enterprise Cloud Costs
The 2026 Enterprise Cloud Economic Landscape
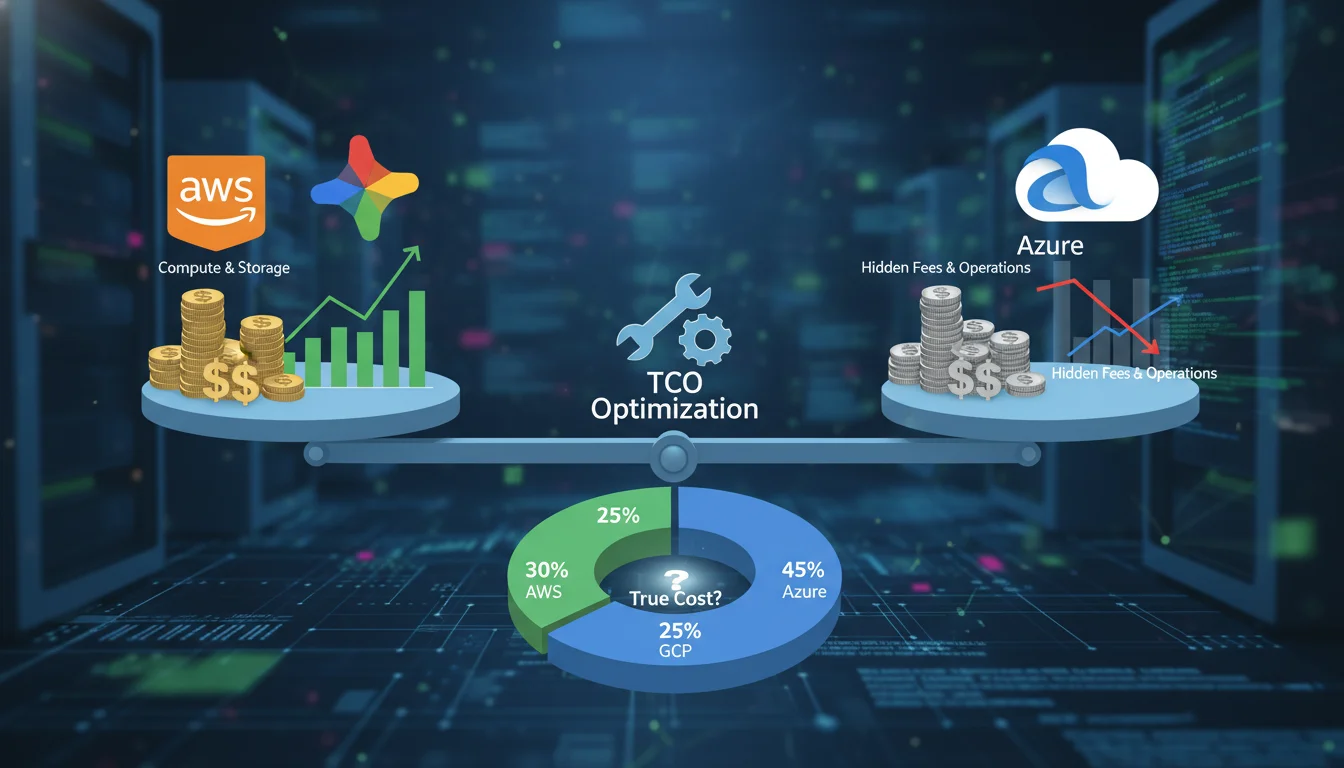
The global enterprise cloud computing market has definitively transitioned from an era of unbridled, speculative technological adoption into a mature phase defined by rigorous financial governance, architectural unit economics, and strategic vendor leverage. As the industry advances into 2026, global public cloud spending is forecast to comfortably exceed the $670 billion threshold, reflecting a year-over-year growth trajectory of approximately 20 percent. The market architecture remains a solidified oligopoly, dominated by Amazon Web Services (AWS) with an approximate 30% to 32% market share, Microsoft Azure capturing 23% to 25%, and Google Cloud Platform (GCP) holding between 11% and 13%.
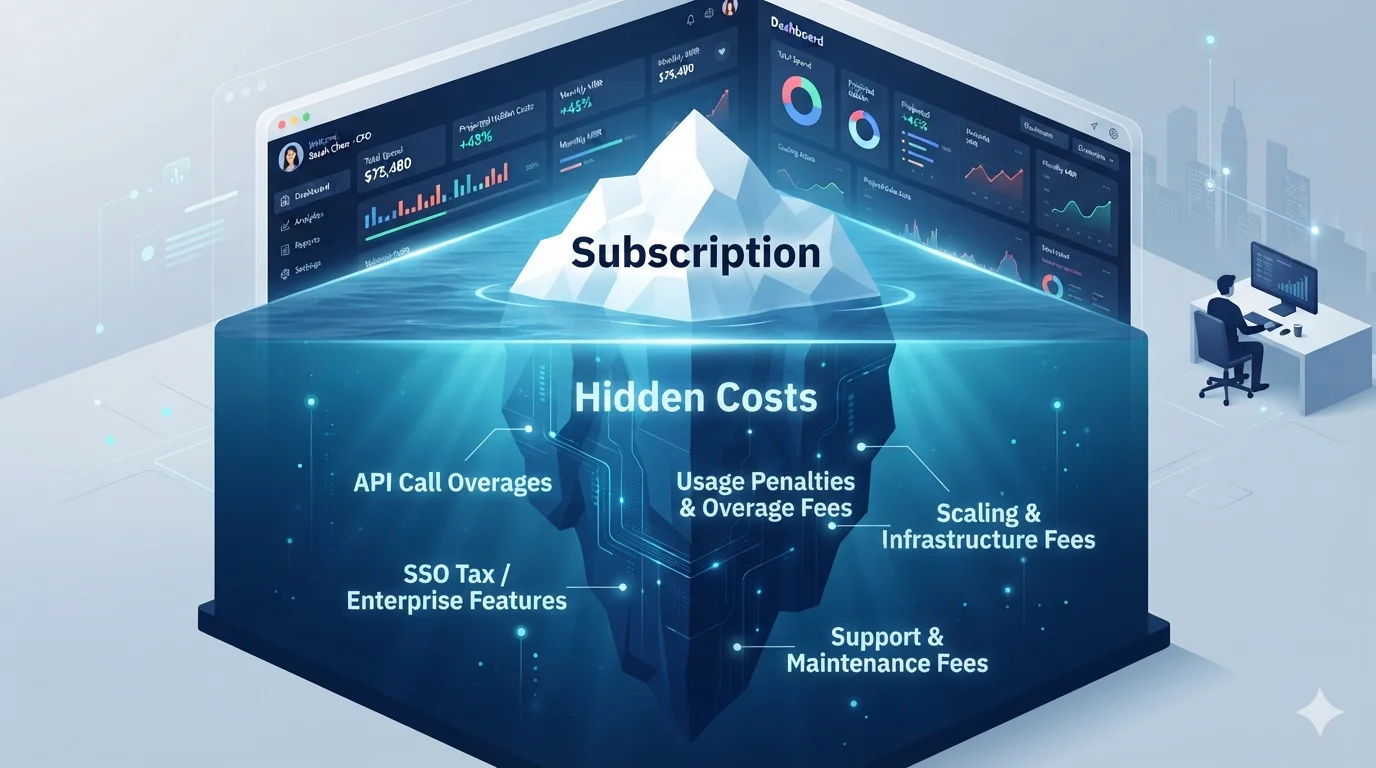
However, the foundational premise of cloud computing—that the shift from capitalized hardware expenditures (CapEx) to dynamic operational expenditures (OpEx) would inherently deliver cost efficiencies—has been severely challenged. Recent industry analysis from the 2026 State of the Cloud Report reveals a critical systemic inefficiency: an estimated 29% of all Infrastructure as a Service (IaaS) and Platform as a Service (PaaS) spending is now categorized as cloud waste. This figure reverses a five-year historical downward trend in infrastructure waste, driven primarily by the explosive adoption of generative AI workloads, highly dynamic scaling requirements, and increasingly opaque billing structures that have outpaced traditional enterprise forecasting capabilities. Furthermore, a staggering 84% of organizations report struggling fundamentally with managing and optimizing their cloud spend.
The illusion of pure “pay-as-you-go” elasticity has been supplanted by the reality of complex enterprise discount programs, insidious vendor lock-in mechanisms, and severe architectural financial penalties. Selecting between AWS, Azure, and Google Cloud is no longer purely a technical evaluation of service catalogs; it is a profound financial decision that dictates an organization’s long-term operating margin structure. Consequently, the discipline of FinOps (Cloud Financial Operations) has evolved from a niche accounting function to a core engineering mandate, with 63% of enterprises now operating dedicated FinOps teams, up from 51% in previous years. As organizations face macroeconomic pressures, analysis indicates that roughly 21% of cloud workloads have been repatriated to on-premises data centers or private cloud environments in an attempt to regain cost control, though the ongoing migration of net-new workloads continues to drive overall public cloud growth.
A granular analysis of baseline compute and storage pricing, egress tax models, regional arbitrage opportunities, high-performance computing (HPC) premiums, and negotiated enterprise agreements is required to decipher the true total cost of ownership (TCO) across these hyperscalers.
Compute Unit Economics: Parity, Commitment, and Volatility
The Illusion of On-Demand Compute Equivalence
General-purpose compute instances form the foundational backbone of most enterprise cloud architectures. When comparing equivalent virtual machines (VMs)—specifically instances featuring 8 vCPUs and 32GB of RAM in the US East region—the un-discounted sticker prices are nearly identical, projecting an image of total commoditization. AWS offers the m5.2xlarge at $0.384 per hour, Azure offers the D8s v5 at an identical $0.384 per hour, and Google Cloud prices the n2-standard-8 at $0.388 per hour. For a standard 730-hour operating month, this translates to approximately $276 to $279 per instance across all three providers.
The divergence in actual cost emerges entirely from how organizations license their underlying operating systems and how they consume native discount mechanisms. Azure possesses a distinct, structural advantage for enterprises deeply entrenched in the Microsoft software ecosystem. Through the Azure Hybrid Benefit, organizations possessing on-premises Windows Server and SQL Server licenses with active Software Assurance can apply these existing licenses directly to Azure VMs. This mechanism can yield an additional 40% to 85% discount compared to running Windows Server workloads on AWS or GCP, effectively forcing Microsoft-heavy enterprises to choose Azure to avoid paying for the operating system licensing twice.
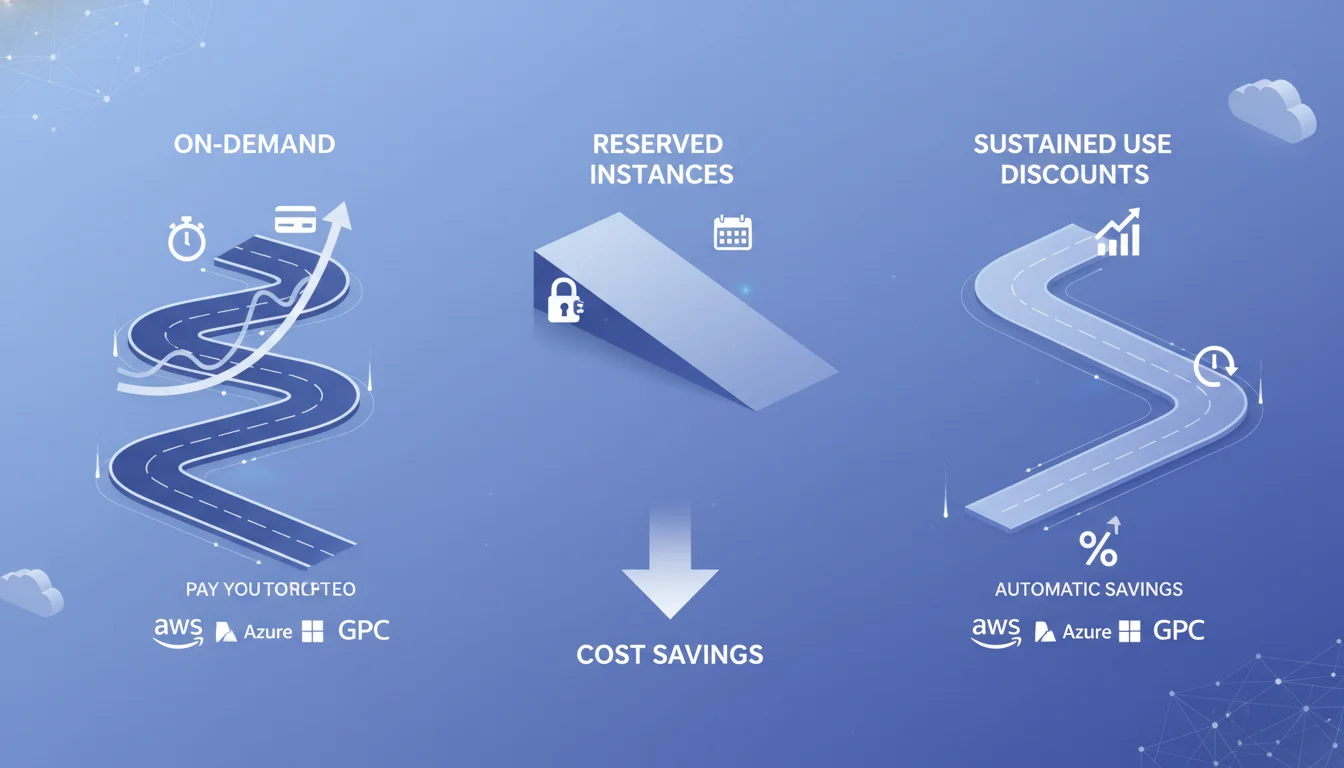
Conversely, Google Cloud engineers its pricing architecture to attract modern, cloud-native, and variable workloads. GCP automatically applies Sustained Use Discounts (SUDs) to resources running for more than 25% of a billing month without requiring any upfront capital commitment or negotiated contract. For instances running continuously 24x7 for an entire month, this results in an automatic 30% discount on the baseline compute cost. AWS, which possesses the most mature but rigid ecosystem, relies heavily on Reserved Instances (RIs) and Compute Savings Plans to lower compute costs, demanding formal 1-year or 3-year financial commitments to achieve up to 72% off on-demand rates.
Spot Market Mechanics and Orchestration Volatility
For fault-tolerant, stateless, or batch-processing workloads, organizations frequently turn to interruptible capacity—known as Spot Instances on AWS and Azure, and Preemptible VMs or Spot VMs on Google Cloud. These instances utilize excess, unallocated data center capacity, offering extraordinary discounts ranging from 60% to 91% off the standard on-demand rates.
According to the 2025 Kubernetes Cost Benchmark Report, the three hyperscalers manage their spot markets with vastly different philosophies. Google Cloud and Azure offer highly predictable spot pricing, with market fluctuations occurring only a few times per month. On average, GCP experiences a new spot price every three months (0.35 times/month), while Azure alters prices slightly less than once a month (0.76 times/month).
In stark contrast, AWS manages its spot market with extreme dynamism to maximize its own internal fleet utilization. Spot prices and availability on AWS fluctuate continuously, averaging an unprecedented 197 distinct monthly price changes for GPU and non-GPU instances. The strategic architectural implication is immense. Running fault-tolerant Kubernetes or AI workloads on AWS spot instances requires highly sophisticated node termination handlers, rapid checkpointing protocols, and continuous market monitoring to gracefully handle constant, unannounced instance terminations. GCP and Azure, offering high price predictability, allow engineering teams to run long-duration batch jobs on preemptible instances with a significantly lower risk of interruption, indirectly lowering the human engineering cost required to manage the infrastructure.
Storage Architecture: Capacity, Performance, and Hidden Operations
Object Storage Tiers and API Taxation
Data reflects standard baseline capacity pricing for the first 50TB in equivalent US regions
| Storage Tier | AWS S3 (per GB/mo) | Azure Blob (per GB/mo) | Google Cloud Storage (per GB/mo) |
|---|---|---|---|
| Standard / Hot | $0.023 | $0.0184 | $0.020 |
| Infrequent / Cool | $0.0125 | $0.0152 | $0.0134 |
| Archive / Cold | $0.004 | $0.002 | $0.0012 |
While Azure Blob Storage appears to be the most cost-effective for frequently accessed hot data at $0.0184 per GB, AWS dominates the infrequent access tier at $0.0125 per GB, making S3 highly optimized for active backup and disaster recovery architectures. For long-term, deep archival storage mandated by compliance regulations, Google Cloud undercuts the market significantly at $0.0012 per GB, closely followed by Azure at $0.002, with AWS remaining the most expensive at $0.004.
However, pure capacity pricing fundamentally masks the true cost of operating cloud storage at an enterprise scale. The hidden multipliers are API operation fees. Cloud providers meter and charge for every individual GET, PUT, COPY, and LIST request executed against the storage bucket. Both AWS and Azure charge $5.00 per one million PUT requests and $0.40 per one million GET requests. For modern data-lake architectures, IoT telemetry ingestion, or applications performing high-frequency micro-transactions, API request costs can frequently exceed the cost of the underlying storage capacity itself.
Block Storage Performance Penalties and Snapshot Storage
Block storage—the persistent disks directly attached to virtual machines—introduces performance-based pricing variables that complicate direct comparisons.
Storage Performance and Cost Dynamics
Google Cloud provides exceptionally high input/output operations per second (IOPS) ceilings natively, offering 40,000 IOPS for reads and 30,000 IOPS for writes on standard volumes, compared to Azure’s standard tier, which severely bottlenecks at 5,000 IOPS. To achieve equivalent disk throughput on AWS or Azure, enterprises are frequently forced to manually over-provision the absolute size of the compute instance or purchase specialized premium disk tiers, creating a cascading scenario where storage performance requirements inadvertently inflate global compute costs.
AWS penalizes high-performance database administrators through its Provisioned IOPS mechanism. While an Amazon EBS General Purpose SSD (gp3) costs $0.08 per GB-month, upgrading to a Provisioned IOPS SSD (io1) escalates the capacity cost to $0.125 per GB-month, plus a punitive ongoing fee of $0.065 per provisioned IOPS-month. This expense scales entirely independently of actual disk capacity or utilization.
Furthermore, backup storage for these volumes introduces quiet but substantial cost overruns. Standard persistent disk snapshots run roughly $0.05 per GB-month across the providers, with archive snapshots available at approximately $0.019 per GB-month. High-frequency automated backups for massive databases (e.g., retaining 30 days of point-in-time recovery data) rapidly consume storage capacity. Azure bills snapshot storage and backup distinctly and separately from the managed disk, often catching financial forecasting teams off guard when backup policies are intensified without budget realignment.
The Disruption of Specialized Storage Providers
The punitive nature of hyperscaler storage pricing has fueled the rise of specialized, independent storage providers. For example, Backblaze B2 offers S3-compatible object storage engineered specifically for active archiving, backup, and media workloads at a flat rate of $6 per TB per month—a fraction of the $23 per TB charged by AWS S3 or the $20 per TB charged by Google Cloud. Furthermore, Backblaze provides free egress up to three times the volume of data stored, directly combating the egress trap utilized by the major providers to maintain data gravity. For enterprises managing multi-petabyte datasets that do not require the full suite of proprietary machine learning tools attached to AWS or GCP, migrating storage to these specialized tiers represents one of the most immediate avenues for TCO reduction.
Network Transit, Egress Taxation, and Data Gravity
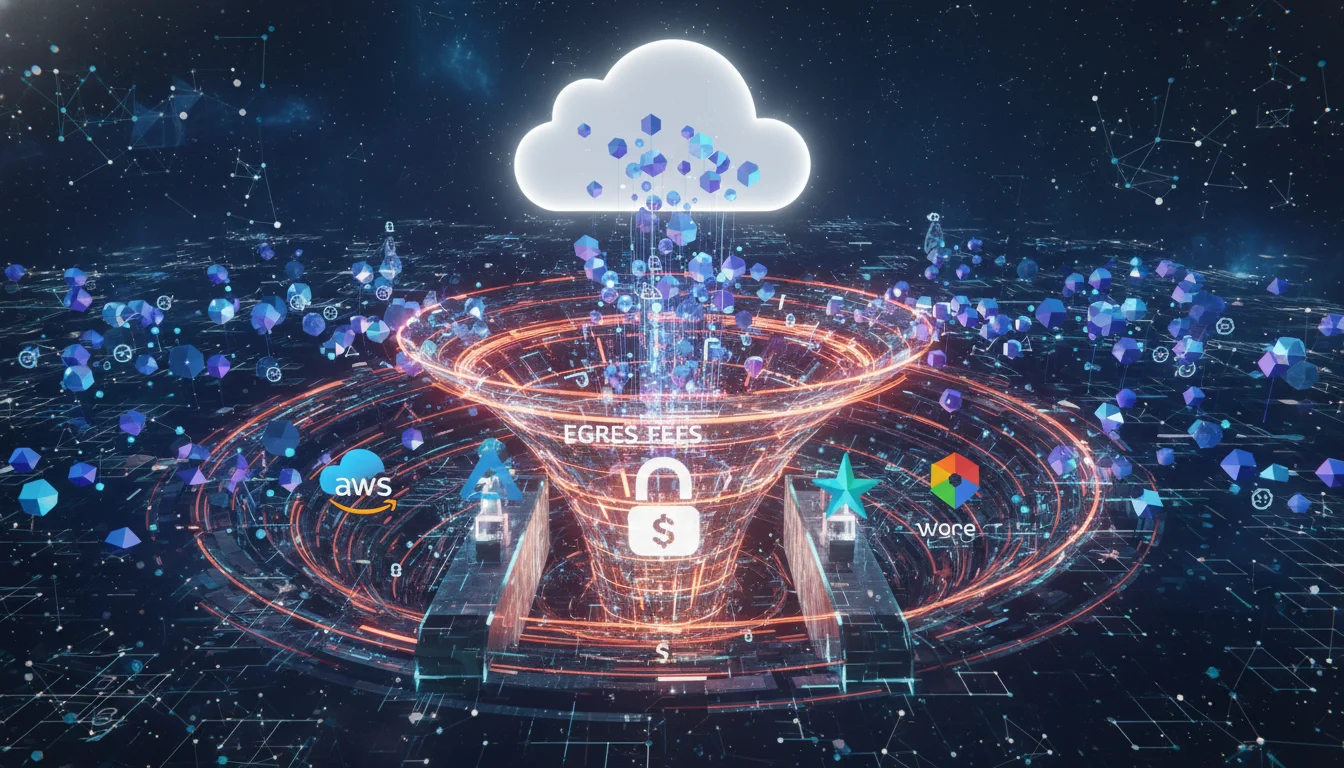
Data transfer fees, particularly egress (the financial cost of data leaving the cloud provider’s network), represent the most controversial, opaque, and highly profitable pricing mechanism employed by hyperscalers. Egress fees are fundamentally designed to create “data gravity,” making it financially prohibitive to migrate large datasets away from a provider, thereby permanently locking enterprises into the provider’s broader, higher-margin ecosystem of analytical and machine learning services.
Internet Egress Penalties
When data is transferred over the public internet to end-users, external applications, or on-premises data centers, steep and unrelenting metering begins.
| Egress Destination | AWS | Azure | Google Cloud (GCP) |
|---|---|---|---|
| Free Tier (Internet) | 100 GB / month | 5 GB / month | 5 GB / month (up to 200GB depending on routing) |
| Internet Egress (First 10 TB) | $0.09 per GB | $0.087 per GB | $0.08 - $0.12 per GB |
| Inter-Region (Cross-Continent) | $0.02 - $0.09 per GB | $0.02 - $0.087 per GB | $0.02 - $0.12 per GB |
| Intra-Region (Cross-AZ) | $0.01 per GB | $0.01 per GB | $0.01 per GB |
(Table based on standard baseline pricing models prior to negotiated volume discounts)
AWS currently offers a relatively generous free tier of 100 GB per month for internet egress, while Azure and standard GCP setups offer a negligible 5 GB. Beyond the free tier, AWS charges $0.09 per GB for the first 10 TB, Azure charges $0.087, and GCP ranges from $0.08 to $0.12 depending on whether the customer utilizes standard routing or premium network tiers.
While pennies per gigabyte appear superficially negligible, enterprise operational realities dictate otherwise. Enterprise data platforms routinely transfer 50 to 200 terabytes monthly. Streaming and media services easily exceed 1 petabyte. At just 100 TB of data transfer, internet egress alone generates a monthly line item approaching $9,000 to $12,000. This creates severe financial friction for organizations attempting to execute multi-cloud strategies or support high-bandwidth consumer applications. To mitigate this, enterprises are forced to implement Content Delivery Networks (CDNs) such as Amazon CloudFront or Azure CDN to cache data at global edge locations, which reduces the effective egress rate but introduces a separate layer of CDN bandwidth pricing (typically $0.06 to $0.08 per GB).
Intra-Network Routing Taxes
The more insidious data transfer costs occur within the cloud provider’s own proprietary network boundaries. Modern enterprise architectural standards mandate high availability, requiring mission-critical applications to span multiple Availability Zones (AZs) within a single geographic region. AWS, Azure, and GCP uniformly charge approximately $0.01 per GB for data traversing across AZs in a bidirectional manner.
Because modern microservices and Kubernetes clusters are highly “chatty”—constantly replicating databases, synchronizing application state, and communicating via internal APIs—cross-AZ traffic scales exponentially as applications grow. A database cluster seamlessly replicating 5 TB of data daily across two availability zones will quietly accrue $1,500 a month purely in internal network transit fees, penalizing the enterprise for adhering to best practices in disaster recovery and resilience.
Google Cloud offers a significant structural advantage for data-heavy analytics architectures: it waives egress fees for data transferred between its own core analytical services. For example, moving petabytes of data from Google Cloud Storage into BigQuery incurs no internal network transfer penalty. This fundamentally alters the TCO for modern data warehousing, making GCP the premier destination for big data analytics compared to AWS, where moving data between S3 and external analytics platforms incurs heavy tolls.
Recently, regulatory pressure—such as the European Union Data Act—has forced cloud providers to offer one-time egress fee waivers for customers permanently migrating off their platforms, though the day-to-day operational egress tax remains firmly intact. In response to this opaque billing, alternative providers like DigitalOcean have gained traction by offering highly transparent pricing models. DigitalOcean includes generous pooled bandwidth with its virtual machines and caps internet egress overages at a flat, predictable rate of $0.01 per GB, entirely eliminating inter-region transfer charges and mitigating bill shock for data-intensive startups.
High-Performance Computing and the Generative AI Premium
The most profound disruption to cloud unit economics in 2025 and 2026 has been the explosive, insatiable demand for Generative AI model training and high-throughput inference. AI workloads are massively compute-intensive, memory-bound, and strictly reliant on specialized hardware accelerators, primarily NVIDIA GPU architectures or proprietary Tensor Processing Units (TPUs). The infrastructure required to support these workloads has forced cloud providers into massive capital expenditure cycles; Microsoft, for instance, spent approximately $65 billion in FY25 entirely on AI-optimized datacenters and capacity expansion.
GPU Compute Economics and Capacity Bottlenecks
Securing high-end GPU capacity (such as the NVIDIA A100 or H100 equivalents) has become a primary bottleneck for enterprise innovation. The pricing disparity between providers for identical hardware is significant, driven by internal data center power constraints, cooling limitations, and supply chain priority.
Comparing equivalent 8-GPU A100 instances reveals the market premium:
- AWS (p4d.24xlarge): ~$28.97 per hour (On-Demand).
- Azure (ND96asr_v4): ~$27.19 per hour (On-Demand).
- Google Cloud (a2-ultragpu-8g): ~$40.11 per hour (On-Demand).
While Azure offers the lowest standard on-demand rate, GCP commands a massive premium for its A100 instances. This reflects Google’s strategic prioritization of its proprietary TPUs and the highly specialized network topologies required for massive cluster synchronization in distributed AI training. For pure HPC and deep learning model training, running on-demand GPU clusters rapidly destroys TCO. A single a2-ultragpu instance running continuously on GCP costs roughly $29,000 per month.
The TCO Intersection of Cloud vs. On-Premises AI
The astronomical cost of renting cloud-based GPUs has reignited the debate over repatriation. Detailed TCO models analyzing high-throughput AI workloads demonstrate that while cloud infrastructure offers flexibility and avoids the upfront capital expenditure of acquiring physical servers, sustained usage quickly reverses the economic advantage. When analyzing server acquisition, power consumption, and cooling costs, deploying physical Lenovo or custom white-box infrastructure on-premises frequently results in a lower TCO for long-term, sustained AI model training compared to indefinite cloud rental.
However, cloud deployments absorb the variable costs of data center power and cooling requirements, which have surged as modern GPUs draw unprecedented wattage.
For enterprises that cannot secure the physical data center power allocation required for massive GPU clusters, the cloud remains the only viable deployment vector, forcing them to absorb the financial premium. To bridge this gap, specialized inference clouds, such as those integrated into DigitalOcean’s architecture via Gradient AI, have emerged to offer up to an 80% lower total cost of ownership for inference-heavy workloads by stripping away the complex PaaS overhead found in traditional hyperscalers.
Managed Databases and PaaS Overheads
Comparing pure Infrastructure as a Service (IaaS) prices is useful for baselining, but modern enterprise cloud architectures heavily leverage managed services (PaaS), particularly managed relational databases. Amazon Relational Database Service (RDS), Azure SQL, and Google Cloud SQL abstract away complex administration tasks such as operating system patching, high availability configuration, and automated backups. However, this convenience carries a severe, compounding pricing premium.
When mapping a medium-sized web application architecture—requiring 8 vCPUs, 32GB RAM, 500GB of standard storage, a managed relational database, and 2TB of internet egress—the total monthly TCO clusters tightly: AWS at ~$587, Azure at ~$559, and GCP at ~$525.
Database Throughput and Scaling Limitations
Scaling these databases unearths critical architectural limitations and cost cliffs. Azure SQL inherently benefits from deep Active Directory (Entra ID) integration and native SQL Server compatibility, making it the default choice for legacy enterprise migrations. However, Azure places hard performance ceilings on its standard tiers, capping IOPS at 5,000 for non-Hyperscale deployments. Furthermore, Azure restricts standard block storage volumes for its databases to 1 TB.
Google Cloud SQL, conversely, is engineered for massive scale without forcing customers into specialized, exotic database architectures. GCP allows for up to 40,000 read IOPS and 30,000 write IOPS on standard managed databases, and supports massive block storage volumes ranging up to 64 TB. This gives Google Cloud a massive throughput advantage for transactional workloads, allowing enterprises to scale vertically much further before undertaking the complex engineering effort of sharding databases or migrating to clustered solutions like Google Cloud Spanner or Amazon Aurora.
Geographic Arbitrage: The Mechanics of Regional Pricing
Cloud computing resources are not priced uniformly on a global scale. The physical costs of operating massive data centers—including real estate acquisition, power grids, advanced cooling systems, local taxation, and labor—are passed directly to the consumer through highly variable regional pricing matrices. Consequently, strategic workload placement can serve as a primary lever for TCO optimization, a practice known within FinOps disciplines as geographic arbitrage.
The US East regions (specifically Northern Virginia) serve as the global baseline pricing index for AWS, Azure, and GCP. Moving workloads outside of North America typically introduces a substantial regional premium. European regions, such as London, Zurich, or Frankfurt, often carry a 10% to 25% price premium over US East. For example, provisioning 10TB of storage in Zurich costs significantly more than the same storage array in Virginia.
Conversely, specific global regions are subsidized to capture local market share or to capitalize on exceptionally cheap local utilities. For instance, GCP’s cheapest global region is Stockholm, Sweden (europe-north2), driven by abundant, low-cost renewable hydroelectric energy and natural ambient cooling. For AWS, regions like Mumbai (ap-south-1) and Ohio (us-east-2) offer compute discounts of up to 32% and 13% respectively compared to premium regions.
The data indicates that careful regional selection can cut an enterprise’s compute and storage bill by up to 40%. For highly regulated industries such as finance, healthcare, or government, strict data sovereignty laws (like GDPR in Europe) legally mandate that primary databases remain within specific geographic boundaries, forcing enterprises to absorb the regional price premiums. However, for non-critical, asynchronous workloads—such as batch log processing, media rendering, or massive AI model training jobs—enterprises can intentionally route compute tasks to the cheapest available global regions. A UK-based enterprise executing AI training models can bypass the local London premium by processing the compute in US East or Mumbai, pulling the resulting trained models back to the UK upon completion. The massive compute savings far outweigh the temporary inter-region data transfer costs incurred during the transfer.
Navigating Enterprise Agreements: EDP, MACC, and CPA
For organizations spending upwards of $1 million annually on cloud infrastructure, the standard pay-as-you-go rates and public reserve instance discounts are merely starting points for procurement. The true economics of enterprise cloud are dictated by private, heavily negotiated contracts. In 2025 and 2026, the mechanics of these agreements underwent significant transformations, reflecting the cloud providers’ shift from high-margin software-centric growth models to capital-intensive utility infrastructure operations.
The Microsoft Azure Consumption Commitment (MACC) Reset
Historically, Microsoft Enterprise Agreement (EA) customers relied on volume-based pricing tiers (Levels A through D), which automatically rewarded massive scale with deep programmatic discounts on Microsoft 365, Azure, and Dynamics 365. However, beginning in November 2025, Microsoft executed a fundamental pricing reset by unilaterally eliminating the EA volume tiers for Online Services.
By flattening the tiers to a single baseline (Level A), Microsoft effectively removed the automatic advantage of scale. For a typical large enterprise managing a $10 million annual EA, this unmitigated policy change forces an immediate, unbudgeted cost increase of 6% to 12%. Consequently, organizations are now entirely dependent on negotiating a bespoke Microsoft Azure Consumption Commitment (MACC) to secure meaningful discounts.
A MACC is a strict contractual obligation to consume a specific monetary amount of Azure services over a fixed term (typically three years). It operates on a punitive “use it or lose it” basis; if a company commits to $10 million but only consumes $7 million in Azure services, they are legally liable to pay the $3 million shortfall upon the anniversary date. As Azure has matured, Microsoft now reserves its most aggressive custom discounts strictly for “mega-deals” exceeding $45 million in total contract value. For standard enterprise commitments ($1M - $5M), discounts typically range from 10% to 40% only when optimized by stacking Reserved Instances and Azure Hybrid Benefits. A critical negotiation lever for MACC agreements is ensuring that third-party software purchases made through the Azure Marketplace count toward the commitment burndown, allowing enterprises to funnel their broader software supply chain (e.g., Snowflake, Databricks, CrowdStrike) through the Azure contract to hit spending thresholds.
AWS Enterprise Discount Program (EDP)
The AWS Enterprise Discount Program (EDP) remains the industry gold standard for high-volume infrastructure procurement. An EDP typically requires a minimum annual spend commitment of $1 million over 1 to 5 years. The discount structure is tiered aggressively based on total committed volume:
- $1M – $5M annual spend: 5% to 12% discount.
- $5M – $25M annual spend: 12% to 20% discount.
- $25M – $100M annual spend: 18% to 30% discount.
- $100M+ annual spend: 28% to 35%+ discount.
Unlike Microsoft’s bundled ecosystem approach, AWS EDPs are strictly infrastructure-focused. The primary danger of the EDP is asymmetric risk. AWS sales structures are engineered to maximize the top-line commitment, often relying on highly optimistic cloud migration timelines provided by the customer’s own IT teams. If those migrations stall due to technical debt or organizational friction, the enterprise is still financially obligated to pay AWS the committed spend. Savvy FinOps teams must rigorously negotiate “drawdown flexibility“—the ability to roll over unused commitments to subsequent years—and strict Mergers & Acquisitions (M&A) provisions to protect the organization against structural changes, divestitures, or spinoffs.
Google Cloud: Custom Pricing Agreements (CPA)
Trailing AWS and Azure in overall market share, Google Cloud deploys the most aggressive commercial tactics to acquire enterprise workloads.
For large organizations, GCP relies on Spend-based Committed Use Discounts (CUDs) and Custom Pricing Agreements (CPAs).
| Provider | Primary Commitment Vehicle | Typical Discount Range | Commitment Flexibility |
|---|---|---|---|
| AWS | EDP | 8% – 35% | Moderate – Drawdown flexibility negotiable |
| Azure | MACC + EA + RIs | 10% – 40% (Combined) | Good – Marketplace burn-down applicable |
| GCP | CUDs + CPA | 17% – 50% | Limited – CUDs are highly rigid |
Commercial baseline comparison for enterprise negotiations
GCP frequently offers total combined discounts approaching 50% for flagship accounts, heavily subsidizing initial migration costs with massive upfront engineering credits. However, Google’s resource-based CUDs are notoriously inflexible, lacking the exchange rights, region-shifting, and instance-family adaptability found in AWS Compute Savings Plans or Azure Savings Plans. This inflexibility means that while GCP looks substantially cheaper on the initial procurement spreadsheet, an architectural pivot midway through a 3-year term can result in millions of dollars of sunk costs tied up in unusable CUDs.
The Regressive Taxation of Enterprise Support Models
Beyond the core primitives of compute, storage, and networking, the most systematically overlooked driver of cloud TCO is enterprise support. AWS, Azure, and GCP structure their highest-tier, mission-critical support plans not as a flat subscription fee, but as a compounding percentage of the organization’s total monthly cloud consumption. As cloud usage naturally scales—particularly with the adoption of highly expensive GPU instances for AI workloads—support costs balloon exponentially, creating a regressive tax on enterprise innovation.
AWS and GCP Percentage Models
AWS restricts advanced technical troubleshooting to its paid tiers. The Business Support+ tier requires a minimum of $29 per month, or a scaling percentage of total spend: 9% of charges up to $10K, tapering down to 3% for charges over $250K.
For mission-critical production environments, organizations are systematically pushed toward Enterprise Support, which guarantees a 15-minute response time for critical outages and assigns a designated Technical Account Manager (TAM). The Enterprise Support baseline is $5,000 per month, or a percentage model:
- 10% of monthly AWS charges up to $150K.
- 7% from $150K to $500K.
- 5% from $500K to $1M.
- 3% over $1M.
An enterprise successfully scaling its infrastructure to spend $2 million monthly on AWS compute will be automatically billed roughly $85,000 per month just for Enterprise Support, regardless of whether they submit a single support ticket.
Google Cloud’s Premium Support perfectly mirrors the AWS pricing structure. It mandates a $15,000 minimum monthly fee or an identical tapering percentage scale: 10% of the first $150K, 7% up to $500K, 5% up to $1M, and 3% over $1M. If a GCP customer consumes $1.2 million in a given month, the Premium Support fee is rigidly calculated as $15,000 + $24,500 + $25,000 + $6,000, totaling exactly $70,500 per month.
Azure Unified Enterprise Support
Microsoft approaches support through the lens of its entire integrated software ecosystem, making Azure Unified Enterprise Support notoriously complex and prohibitively expensive for diverse enterprises. Rather than billing based purely on current-month Azure infrastructure consumption, Microsoft calculates the Unified Enterprise cost by taking a percentage of the organization’s entire historical IT spending over the past 12 months. This includes Azure consumption, Microsoft 365 licenses, Dynamics 365 seats, and on-premises software like Windows Server and SQL Server.
Because the baseline contract starts at $50,000 and scales infinitely with total enterprise growth, organizations are mathematically penalized for migrating more workloads to Azure. The bundled nature of Unified Support means a company expanding its Office 365 footprint for remote workers inadvertently raises the cost of its Azure cloud infrastructure support. This creates a frustrating financial entanglement that increasingly prompts enterprises to seek third-party support alternatives or strictly cap support liabilities.
FinOps, Private Cloud Alternatives, and Strategic Governance
The realization that public cloud is not inherently cheaper has catalyzed the rapid formalization of Cloud Financial Operations (FinOps). Organizations are moving beyond simple cost-cutting and are now focusing on establishing Cloud Centers of Excellence (CCOEs), with 71% of organizations operating a centralized CCOE to assess cloud progress based on value delivered to business units rather than pure bottom-line reduction. To manage this complexity, an entire ecosystem of third-party cloud cost management tools has emerged. Platforms like Economize support startups with up to $100K in spend, while mid-tier options like Vantage bridge the gap, and enterprise platforms charge $45K+ per year to provide multi-cloud visibility, unified recommendations, and automated discount scheduling.
The Private Cloud and API Debt
For enterprises experiencing severe bill shock—particularly those crossing the $20K/month threshold on AWS—the mathematical viability of private cloud architecture has re-emerged. Solutions based on OpenStack, provided by vendors like OpenMetal, offer transparent, fixed-cost infrastructure without the compounding penalties of egress fees, API call charges, or free-tier expirations.
The primary barrier to repatriation or private cloud migration is “API Debt.” When development teams heavily utilize proprietary cloud APIs (such as AWS DynamoDB or Google Cloud Spanner) instead of open-source equivalents, they create a long-term financial dependency that compounds over time. This vendor lock-in drastically inflates the migration debt, ensuring that the cost to rewrite the application to run on private infrastructure often exceeds the short-term savings of moving off the public cloud.
Conclusion and Strategic Recommendations
The modern enterprise cloud is an environment defined by deep ecosystem moats, predatory data transfer taxes, and complex financial instruments. The parity in base compute pricing is a mirage; the true total cost of ownership is determined by a combination of Microsoft licensing leverage, Google Cloud’s analytical egress exemptions, and AWS’s rigid but vast architectural ecosystem.
The data unequivocally indicates that relying on vendor-provided consumption models is a primary driver of the 29% cloud waste metric afflicting the industry. To effectively navigate this landscape in 2026, enterprise IT and procurement leadership must adopt a mature FinOps mindset and execute the following strategic imperatives:
- Establish Primary-Secondary Multi-Cloud Leverage: Single-vendor strategies destroy negotiation leverage. Enterprises must adopt a “primary plus secondary” cloud architecture—for instance, placing 70% of workloads on AWS and 30% on GCP. This multi-cloud footprint, while introducing operational complexity, provides credible defection threats during EDP, MACC, or CPA negotiations, allowing procurement teams to extract maximum discounts and custom egress waivers.
- Isolate and Audit Egress and API Sprawl: Architecture dictates cost. Engineering teams must map data gravity before writing code. Applications that require heavy cross-AZ replication or public internet egress should be routed through specialized CDNs to cache data at the edge, drastically reducing the provider’s standard $0.09/GB toll rate. Furthermore, analytical workloads should be aggressively centralized on platforms like GCP, where internal network transit between data lakes and warehouses is financially protected. Alternatively, object storage should be migrated to specialized providers like Backblaze B2, which offers $6/TB pricing and free egress, bypassing the hyperscaler tax entirely.
- Decouple Support from Consumption: As Generative AI and GPU workloads artificially inflate monthly cloud spend, the percentage-based Enterprise Support models become mathematically unsustainable. Enterprises scaling past $10 million in annual cloud spend must negotiate hard flat-fee support caps during their contract renewals or shift toward specialized third-party managed service providers (MSPs) to break the regressive support tax cycle.
- Exploit Geographic and Spot Arbitrage: Cloud computing is a global commodities market. By divorcing asynchronous, high-throughput compute tasks from prime geographic regions (like US East or London) and routing them to highly subsidized regions (such as Stockholm or Mumbai), organizations can realize baseline infrastructure savings of up to 40%. Combining regional arbitrage with the highly predictable spot market pricing of GCP or Azure further multiplies these cost efficiencies.
Ultimately, the cheapest cloud provider is entirely contextual. AWS remains the most mature for foundational, scalable infrastructure; Azure holds an unassailable TCO advantage for legacy Microsoft enterprises leveraging existing software assets; and Google Cloud provides the most cost-efficient environment for massive data analytics and open-source, container-native architectures. Mastery of the cloud no longer belongs solely to the software engineer—it belongs to the architect who can meticulously manipulate the unit economics of the hyperscale oligopoly.