Supply Chain Resilience: Mitigating Freight Cost Volatility
The Global Supply Chain Resilience Framework: Mitigating Freight Cost Volatility
The contemporary global economic landscape has undergone a structural transformation, shifting from a paradigm of lean, cost-centric logistics toward a comprehensive model of systemic resilience. This shift is a direct consequence of a decade marked by high-magnitude disruptions, including the COVID-19 pandemic, escalating regional conflicts, and the intensifying impact of geoclimatic hazards on critical trade corridors. The Global Supply Chain Resilience Framework provides an expert-level architecture for navigating this volatility, particularly regarding freight cost management. The framework is built upon the synergy of digital empowerment, geopolitical adaptation, and green transition, aiming to stabilize the “heart-tremors” embedded in global supply lines. Central to this analysis is the Resilience Dividend, a concept that reframes resilience not as a sunk cost or an operational burden, but as a strategic investment capable of generating non-linear returns during periods of both stability and crisis.
Theoretical Foundations of Resilience and the Triple Dividend
To understand the mitigation of freight cost volatility, one must first establish the theoretical underpinnings of supply chain resilience. Resilience is defined as the capacity of a system to maintain essential function, absorb disruption, and recover or reconfigure rapidly after a shock. Unlike traditional efficiency models that prioritize lowest-unit-cost procurement, the resilience-led model integrates speed, agility, and ESG compliance into a “risk-adjusted total value” equation. This approach acknowledges that a slightly more expensive part arriving on time is infinitely more valuable than a low-cost part stuck in a geopolitical standoff.
The economic logic of this shift is articulated through the Triple Dividend of Resilience framework, developed by the Overseas Development Institute in collaboration with the World Bank. This framework categorizes the benefits of resilience investment into three distinct layers of value creation.
| Dividend Category | Economic Mechanism | Long-term Impact on Freight Costs |
|---|---|---|
| First Dividend | Avoided Losses | Direct reduction in property damage, mortality, and immediate economic losses when a shock occurs. |
| Second Dividend | Unlocking Economic Potential | Reduction in “background risk” encourages higher levels of saving, investment, and planning. |
| Third Dividend | Social and Environmental Co-benefits | Synergistic gains such as improved livelihoods, ecosystem protection, and sustainable infrastructure. |
While the first dividend focuses on reactive protection, the second and third dividends represent a paradigm shift in financial planning. In the transport sector, for instance, early warning systems and disaster-resilient infrastructure allow for better route planning and resource allocation, effectively smoothing the volatility curve. However, the realization of the second dividend is often constrained in developing regions by a lack of access to finance, suggesting that institutional ownership and resourcing are critical prerequisites for resilience to function as a catalyst for economic growth.

The Technological Pillar: Digital Empowerment and Predictive Intelligence
Digital transformation serves as the primary technological driver within the framework, enabling firms to move from paper-based, siloed operations to connected, intelligent systems. The integration of Artificial Intelligence (AI), blockchain, Internet of Things (IoT), and big data analytics creates a dynamic ecosystem capable of real-time optimization.
Digital Drive and Operational Efficiency

In the specific context of the China-Europe Railway Express, digital technology has been shown to improve operational efficiency by more than 30%. This improvement is primarily driven by the application of “channel brains”—centralized data platforms that consolidate customs clearance, logistics, and transit data. For example, the Chongqing “channel brain” has collected over 340 million data points, reducing information inquiry times from several hours to a few seconds. This technological empowerment is measured through specific indicators: the reduction rate in customs clearance time and the digital transformation rate of operating enterprises.
Blockchain technology provides a particularly robust mechanism for stabilizing freight costs by ensuring the “cultural translatability” and mutual recognition of customs documentation across borders. By creating an immutable ledger of transactions, blockchain minimizes the administrative delays and “hidden costs” associated with disparate national regulations.
Predictive Resilience and Multi-Agent Systems
The next frontier of digital empowerment lies in predictive resilience and Multi-Agent Systems (MAS). These frameworks utilize real-time optimization models to adjust to traffic conditions, weather, and other stochastic shocks. In port operations, MAS architecture facilitates decentralized decision-making among dynamic agents, enhancing space allocation and vehicle flow. This reduces terminal occupancy and container dwell times, which are critical variables in the total landed cost of freight.
Key Performance Indicators (KPIs) for Technological Resilience
| Indicator | Definition and Measurement | Strategic Relevance |
|---|---|---|
| Technology Readiness Level (TRL) | Scale of 1-9 measuring technical maturity. | Determines the feasibility of integrating modes like Hyperloop. |
| Interoperability Maturity Level | Scale of 0-5 assessing system compatibility. | Essential for seamless multimodal and cross-border transitions. |
| Reduction in Customs Time | Percentage decrease in border processing duration. | Direct correlation with lower inventory carrying costs. |
| Information Inquiry Speed | Time required for logistics data retrieval. | Critical for “near-real-time” response to disruptions. |
The Tactical Pillar: Geopolitical Adaptation and Route Diversification
Geopolitical friction represents perhaps the most volatile variable in global freight costing. Regional conflicts and institutional differences act as major obstacles to trade stability, often leading to sudden spikes in detour costs and insurance premiums. Geopolitical adaptation is the tactical ability of a supply chain to mitigate these risks through coordination and diversification.
Case Study: The 2025 Poland-Belarus Border Port Suspension
A significant demonstration of geopolitical volatility occurred in July 2025, when Poland unilaterally suspended railway freight passage at a key border port with Belarus. This node undertook 35% of the CER Express transit volume on the northern line, and its closure forced a mass detour of freight. The consequences were both operational and financial:
- Transit Time: One-way transportation time extended from a baseline of 12 days to between 18 and 22 days.
- Cost Volatility: Container detour costs and additional transit fees resulted in an increase of approximately $12,000 USD per container.
- Tactical Response: This incident underscored the necessity of “geopolitical coordination” and the acceleration of the southern and central corridors (e.g., the Almaty-Istanbul route) to reduce dependency on a single transit country.
Mitigating Geopolitical Risk through Diversification
The framework advocates for “friend-shoring” and “near-shoring” as tactical responses to volatile corridors. Indian manufacturers, for instance, are increasingly shifting toward “trusted geographies,” even when it results in a “resilience premium” of 3-5%. For high-value, high-risk items like semiconductors, this premium is an economically viable alternative to the catastrophic cost of a line stoppage. To manage the potential “resilience inflation” caused by regionalization, companies are employing regional hubs to consolidate logistics and maintain complexity at manageable levels.
Indicators of Geopolitical and Tactical Resilience
| Variable | Metric | Impact on Cost Stability |
|---|---|---|
| Transportation Cost Change Rate | Percentage cost increase due to geopolitical friction. | Directly measures financial vulnerability to state-level actions. |
| Train Volume Recovery Rate | Speed of service restoration after a shock. | Indicates the “restorative resilience” of the logistics network. |
| Inbound-Outbound Balance | Ratio of loaded containers in both directions. | Essential for optimizing equipment usage and reducing empty-repositioning costs. |
| High-Value Cargo Proportion | Percentage of high-added-value goods (e.g., electronics). | Justifies higher freight rates through improved profit margins. |
The Operational Pillar: Green Transition and Environmental Regulation
The operational pillar of the framework integrates sustainability as a fundamental component of resilience. Environmental Regulation (ER) is no longer a peripheral compliance issue but a core driver of supply chain security. By internalizing external environmental costs, ER promotes a green transformation that enhances the internal production capacity and vitality of the supply chain.
Environmental Regulation as a Resilience Enhancer
Recent econometric examinations of the Cobalt Supply Chain Resilience have established that effective environmental regulation significantly enhances systemic stability. ER functions through three specific channels:
- Green Technological Innovation: Driving investments in advanced mineral processing and automated smelting, which improve resource efficiency and reduce reliance on unstable primary sources.
- Trade Restructuring: Guiding the diversification of import sources and encouraging the development of “urban mines” through circular economy mandates.
- Internal Vitality: Strengthening the domestic processing and recycling capabilities to reduce exposure to international market fluctuations.
Capital Spillover Effects: Attracting high-quality Foreign Direct Investment (FDI) that prioritizes long-term institutional stability over short-term cost savings.
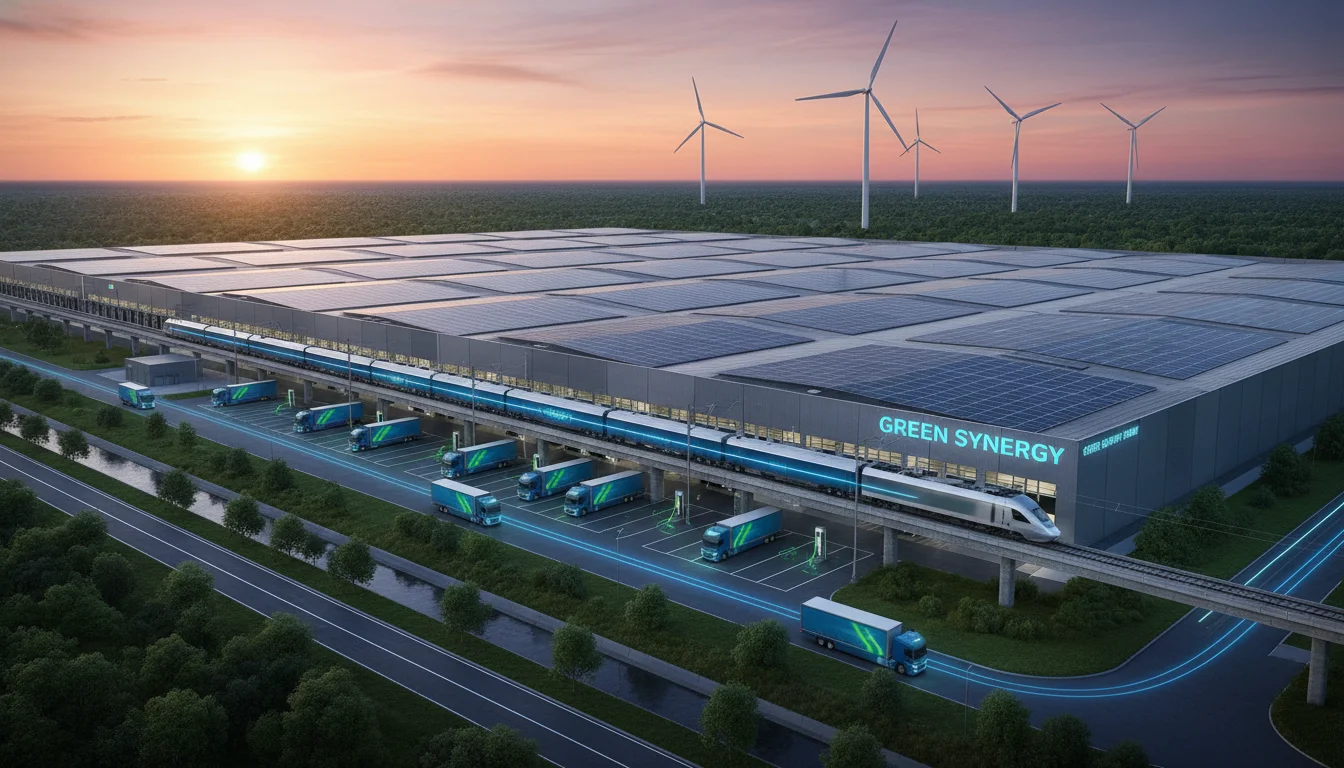
Electrification and Decarbonization of Freight Corridors
The CER Express provides a tangible example of how operational green transition stabilizes long-term costs. The corridor’s railway electrification rate reached 75.8% in 2024, lowering the carbon footprint and providing a buffer against future carbon taxes. The introduction of “zero-carbon trains” and the construction of “photovoltaic + charging” infrastructure—aiming for over 70% green power by 2030—demonstrate a commitment to “green synergy”. This transition is supported by policy frameworks such as the 2024 “Action Plan for Effectively Reducing the National Logistics Costs,” which provides the “policy guarantee” for sustainable operational reforms.
Key Metrics for Green Operational Resilience
| Resilience Dimension | Indicator | Attribute |
|---|---|---|
| Pressure Resilience | Environmental Governance Level | Positive (+) Impact on Stability |
| Impact Resilience | Carbon Emissions from Traded Resources | Negative Impact on Sustainability |
| Driving Force Resilience | Industrial Structure and Output Value | Positive (+) Impact on Economic Growth |
| Operational Transition | Green Power Application Proportion | Measures progress toward zero-carbon logistics |
Quantitative Modeling of Supply Chain Shock and Recovery
A robust resilience framework must be grounded in quantitative models that allow for simulation and performance evaluation. Neoclassical growth theory and integrated assessment models (IAMs) provide a basis for predicting how systems return to a steady state after a shock to the capital stock or labor supply.
Evaluating Connectivity and Resilience Gains
The meta-analysis of transportation investments reveals that regions with low baseline accessibility often display the largest proportional gains from resilience-oriented projects.
Comparative Impact of Transportation Resilience Investments
| Outcome Family | Pooled Effect Size (g) | Interpretation of Gain |
|---|---|---|
| Accessibility Expansion | 0.41 | Moderate to large connectivity improvement |
| Interaction-Intensity Change | 0.35 | Increased frequency and volume of trade flows |
| Redundancy/Robustness | 0.33 | Improved ability to resist damage and provide alternatives |
| Recovery-Performance | 0.30 | Faster return to baseline functionality after disruption |
| Continuity-of-Flow | 0.25 | Stabilization of freight through-movement |
These findings suggest that “freight-intensive regions” register significantly higher resilience gains compared to general passenger corridors (g = 0.37 vs 0.21). Furthermore, hazard context is a critical moderator; flood-exposed and coastal corridors show the largest resilience effects (g ≈ 0.38), highlighting the importance of tailored interventions for climate-vulnerable coastal regions.
Case Analysis: The Evolution of the CER Express
The CER Express serves as the core logistics carrier of the Belt and Road Initiative (BRI) and offers a comprehensive dataset for analyzing freight stabilization.
Scale and Structure of the Eurasian Land Bridge
By the end of 2024, the network covered 128 cities in China and 229 cities in 26 European countries, forming a multi-layered channel system.
CER Express Operational Data
| Year | Number of Trains (Units) | Cargo Volume (10,000 TEUs) | Total Cargo Value ($100M USD) | Loading Rate (%) |
|---|---|---|---|---|
| 2018 | 6,363 | 60.4 | 179 | 90.1 |
| 2019 | 8,225 | 72.5 | 243 | 92.4 |
| 2020 | 10,180 | 97.6 | 340 | 94.8 |
| 2021 | 15,183 | 146.8 | 592 | 97.5 |
| 2022 | 16,005 | 160.4 | 749 | 98.2 |
| 2023 | 17,490 | 189.8 | 864 | 98.5 |
| 2024 | 19,300 | 207.7 | 988 | 99.1 |
The Compound Annual Growth Rate (CAGR) for the number of trains stands at 25.3%, while the total cargo value has grown at a CAGR of 33.5%. This “leapfrog development” is not merely a matter of scale but also of efficiency; the loading rate has consistently approached saturation (99.1%), indicating high resource utilization and a reduction in wasted capacity.
Performance at Key Border Ports
The resilience of the network is anchored by its major border crossings, which serve as strategic “valves” for Eurasian trade.
Traffic Distribution at Major Rail Ports
| Port Name | Trains (Units) | YoY Growth (%) | Proportion of Total (%) | Main Corresponding Channels |
|---|---|---|---|---|
| Alashankou | 6,797 | 34.9 | 35.0 | Western, Northern, Central |
| Manzhouli | 4,387 | -12.6 | 22.7 | Eastern, Northern |
| Erenhot | 3,800 | 14.6 | 19.7 | Central, Northern |
| Horgos | 3,370 | 4.1 | 17.5 | Western, Central |
| Tongjiang North | 858 | 56.3 | 4.5 | Eastern, Northern |
The significant decline at Manzhouli (-12.6%) contrasted with the explosive growth at Tongjiang North (56.3%) illustrates the dynamic “route optimization” that occurs within the GSCRF as operators respond to changing regional conditions.
Mathematical Modeling of Freight Cost Mitigation
For industries with heavy hardware components, such as utility-scale solar projects, logistics and sourcing strategies act as “Process Efficiency Multipliers” (PEM). Strategic integration of these elements can generate non-linear, multiplicative savings on the overall project cost.
Impact of Logistics on the Levelized Cost of Energy (LCOE)
The LCOE is highly sensitive to lead time variability and freight volatility. The Levelized Cost of Energy can be calculated considering the following variables:
- It: Investment expenditures in year t.
- Mt: Operations and maintenance expenditures in year t.
- Ft: Freight and logistics costs (modeled for volatility) in year t.
- Et: Electricity generation in year t.
- r: Discount rate.
- n: Lifetime of the project.
Analysis using the I-LCOE model across markets like the U.S., Germany, and Vietnam shows that optimized supply chain strategies—such as Just-in-Time (JIT) inventory and diversified procurement—achieve quantifiable LCOE reductions of 4.1% to 11.5%. This is vital considering that between 2020 and 2022, freight costs for solar components increased from $0.01/W to as high as $0.07/W due to global “heart-tremors” in supply lines.
Mitigation Framework: Tactical, Operational, and Technological Strategies
The GSCRF provides a structured categorization of mitigation measures designed to control freight cost volatility through a “Resilience-by-Design” approach.
Comprehensive Mitigation Framework
| Measure Category | Key Strategies | Documented Impact |
|---|---|---|
| Technological | AI-based Demand Forecasting; Blockchain ledgers; Digital Control Towers. | 10-20% reduction in operational costs; real-time visibility. |
| Tactical | Production Smoothing; Multi-tier visibility; Route Diversification. | Buffers demand variability; prevents “catastrophic” stoppage. |
| Operational | Lean Manufacturing; Route Optimization for Emissions; Near-shoring. | 15-25% lower production costs; immediate fuel savings. |
Lean Philosophy and Total Quality Management (TQM)
The integration of Lean manufacturing and TQM remains a fundamental lever for cost efficiency. Lean philosophy emphasizes the elimination of waste and value creation, while TQM focuses on data-driven decision-making and standardization. When these traditional methodologies are combined with Industry 4.0 technologies—such as IoT and robotics—they redefine the efficiency frontier, allowing for a 10-20% reduction in operational costs while simultaneously improving service levels.
Sector-Specific Resilience Deep-Dives
The application of the GSCRF reveals distinct patterns of resilience across different asset classes and industries.
Airport Resilience: Robustness vs. Restorative Capacity
For capital-intensive infrastructure like airports, resilience is measured through two complementary layers: “scale-based operational robustness” and “restorative resilience”.
- Robustness: The ability to continue generating net positive aggregate welfare (Social NPV > 0) during a shock.
- Restorative Resilience: The capacity to adjust through market reorientation, such as the shifts in traffic composition and passenger volumes observed at Pulkovo Airport following sanctions and the COVID-19 pandemic.
- Contractual Resilience: In Public-Private Partnership (PPP) concessions, adaptive structures—such as “restructuring triggers” and “renegotiation pathways”—allow airports to sustain service during unprecedented revenue collapses.
Rare Earth Elements (REE) and Strategic Minerals
The REE supply chain demonstrates the critical nature of “upstream-midstream-downstream” resilience. China’s dominance across all components has prompted the formation of collaborative initiatives, such as Australia’s “rare earth highway,” aimed at maintaining resilience within ESG frameworks. This sector’s resilience is defined by fractionalization (dividing production into smaller stages) and dispersion (geographic division based on resource availability).
Challenges and Barriers to Global Implementation
Despite the clear economic imperative of the “Resilience Dividend,” several systemic barriers persist.
- Data Fragmentation: Records typically scatter across multiple ERP systems and regional operations, creating “fragmented views” that mask critical vulnerabilities.
- The Resilience Premium: While strategic, near-shoring and friend-shoring can lead to “resilience inflation” for low-margin commodities, making regionalization economically challenging without regional hubs.
- Skill and Infrastructure Gaps: The adoption of digital tools is often hindered by high implementation costs, workforce skill gaps, and infrastructural constraints in developing economies.
Inconsistent Standards: Carbon accounting and environmental performance requirements vary significantly across jurisdictions, creating hurdles for the global “green synergy” required by the framework.
Future Outlook: Synchromodality and High-Speed Logistics
The future of the GSCRF is increasingly defined by “synchromodal” systems and the integration of next-generation transportation modes like Hyperloop.
- Synchromodal Logistics: This involves real-time, flexible switching between transportation modes (rail, road, sea, air) to optimize for speed, cost, and emissions simultaneously.
- Hyperloop Technology: Future infrastructure planning is already incorporating Hyperloop as a “high-speed logistics” mode, capable of redefining the “Technology Readiness Level” of the global transport sector.
- AI and Self-Evolving Models: The transition from “static and reactive” to “dynamic and predictive” will be completed through AI models that “self-evolve” based on operational experience, further narrowing the gap between evolving regulations and industrial adoption.
Strategic Conclusions and Policy Recommendations
The Global Supply Chain Resilience Framework provides a definitive path for mitigating freight cost volatility in an age of surging uncertainty. The analysis confirms that the most efficient supply chain is no longer the one with the lowest unit cost, but the one that is the most “shock-proof”.
Recommendations for Global Stakeholders
To maximize the “Resilience Dividend” and stabilize the global trade ecosystem, the following expert-level recommendations are proposed:
- Policy and Regulation: Governments must provide “policy guarantees” and financial incentives for technology adoption and green energy facilities, such as the electrification of railway corridors and “photovoltaic + charging” stations.
- Institutional Coordination: Establishing multilateral coordination mechanisms (e.g., the CER Express Transit Coordination Mechanism) is essential to prevent unilateral border closures and ensure the convergence of international railway rules.
- Digital Integration: Organizations must prioritize the elimination of “data silos” by investing in blockchain for customs documentation and digital control towers for multi-tier visibility.
- Environmental Strategy: Environmental regulation should be viewed as a transformative force for green technological innovation and trade restructuring rather than a cost burden.
- Infrastructure Investment: Stakeholders should diversify logistics routes to reduce dependency on volatile “single-corridor” dependencies, utilizing “genuine alternatives” such as parallel routes and expanded terminal flexibility.
By aligning operational decisions with technological capability and risk-management priorities, global enterprises can shift from “buying parts” to “orchestrating resilient ecosystems,” thereby safeguarding the prosperity of today and for future generations.