Looker Studio Marketing Dashboards: Free Templates and Build Guide (2026)
Stop emailing PDF screenshots of GA4
Agency clients and Nepali SME owners do not want to log into Google Analytics. They want one link that answers: “Are we getting leads, from where, and is it getting better?”
Looker Studio (formerly Google Data Studio) is the free reporting layer I pair with GA4, GTM, and Google Ads on client projects. This guide covers how we structure dashboards, the free template concept for repeatable delivery, and connector patterns referenced in our AI automation stack for agencies and n8n self-hosted guide.
Why Looker Studio over paid BI tools
| Factor | Looker Studio | Power BI / Tableau |
|---|---|---|
| Price | Free | License cost |
| GA4 integration | Native | Connector setup |
| Client sharing | URL + PDF schedule | Varies |
| Learning curve | Low for marketers | Steeper |
| Nepal agency fit | High | Overkill for SMB clients |
For enterprise clients with warehouse data, BigQuery + Looker Studio scales. For a Kathmandu clinic or trekking agency, GA4 + Sheets + Looker is sufficient.
Core data sources
Connect these first:
| Source | Connector | Dashboard use |
|---|---|---|
| GA4 | Native | Traffic, conversions, landing pages |
| Google Search Console | Native | Queries, impressions, CTR |
| Google Ads | Native | Spend, CPC, conversions |
| Google Sheets | Native | Manual KPIs, Meta Ads import, CRM counts |
| Meta Ads | Supermetrics, Windsor, or Sheets ETL | Spend, ROAS |
| YouTube | Native | Channel performance |
Nepali clients often run Meta + Google split — plan a Sheets staging tab if you skip paid Meta connectors.
The three-page dashboard template (free template concept)
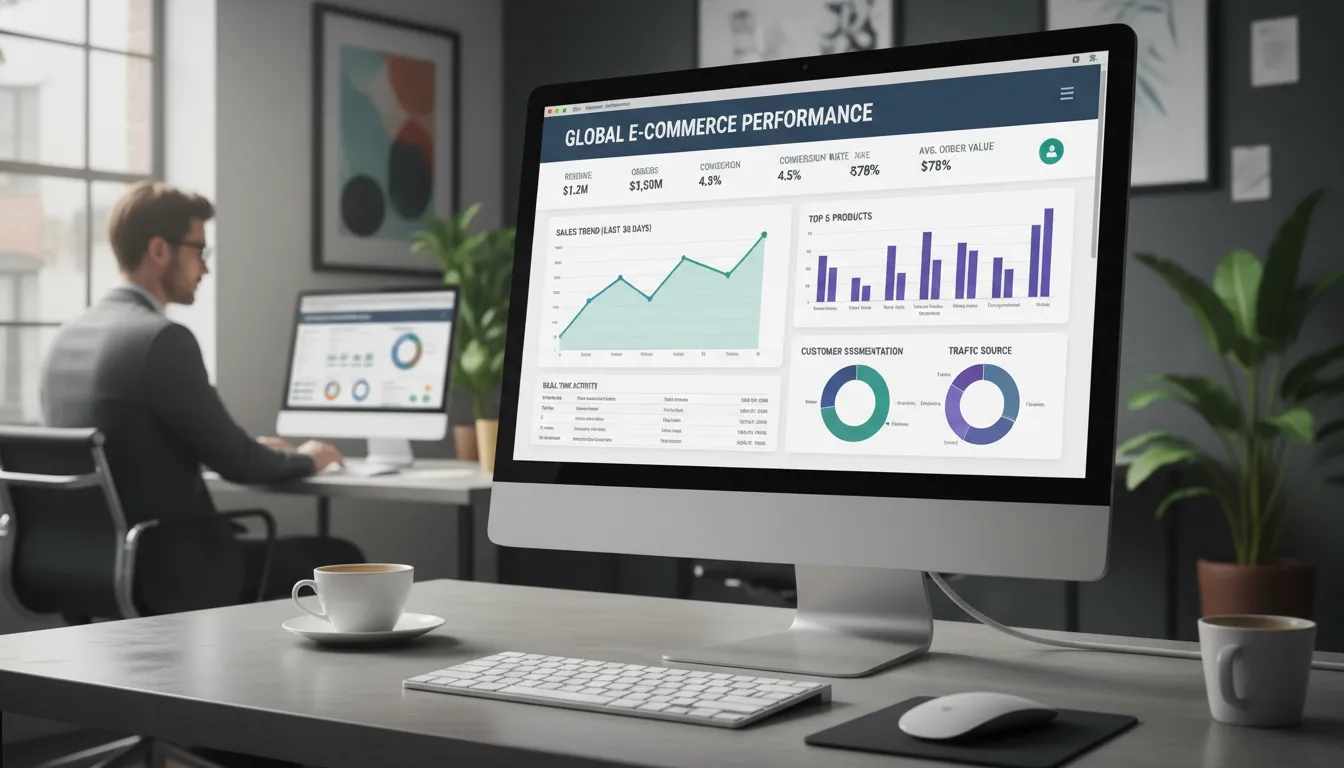
We standardize client reports on three pages — copy this structure as your “free template” starting point:
Page 1: Executive summary
One screen, no scrolling on 1080p:
- Date range control (default: last 30 days vs prior 30)
-
Scorecard: Sessions Conversions Conversion rate Ad spend (if applicable) - Time series: Sessions + Conversions dual axis
- Channel bar chart: Organic, Paid, Direct, Social, Referral
- Insight text box (manual): 2–3 bullet narrative updated monthly
Page 2: Acquisition deep dive
- Source/Medium table with conversions column (sort by conversions, not sessions)
- Landing page table — top 20 by entrance
- Search Console query table — top queries by clicks
- Geo map — Nepal districts or cities if volume supports
Page 3: Campaign performance (if ads running)
- Google Ads: Campaign table (cost, clicks, conversions, CPA)
- Meta (via Sheets): Ad set performance
- Creative notes field — which ad copy/image changed this month
Template distribution: Duplicate the report → replace data source → re-map fields. Store master template in a shared agency Drive folder. Name convention: [CLIENT]_Marketing_Master_Template.
GA4 field mapping essentials
Common mistakes that break templates:
| Wrong field | Use instead |
|---|---|
| Universal Analytics metrics | GA4 event-based metrics |
bounceRate alone |
Engagement rate + average engagement time |
| All events as conversions | Mark only business events (see GTM recipes) |
pagePath without hostname filter |
Filter staging domains out |
Standard conversion events for Nepal business sites:
-
generate_lead(forms) -
phone_call_click(tel:taps) -
messaging_app_click(WhatsApp/Viber) -
purchase(e-commerce)
Calculated fields worth creating
Conversion Rate = Conversions / Sessions
Cost Per Lead = Ad Cost / Conversions  (blend Ads + GA4)
WoW Change = (This week - Last week) / Last week
Label metrics in plain language on the chart — “Website form leads” not eventCount.
Filters every dashboard needs
- Hostname filter — production domain only
- Bot filter — GA4 handles most; exclude internal IP if needed
-
Staging path exclude —
/test/,/dev/ - Country filter — optional Nepal-only view for local campaigns
Branding and client experience
- Upload client logo (SVG or PNG, light background)
- Match primary color to client brand (chart palette)
-
Footer: “Prepared by [Agency] Data through [date]” - Enable viewer email report schedule (weekly Monday 9 AM NPT)
White-label the report URL slug where possible. Clients share internally — make it presentable.
Nepal-specific reporting notes
- Festival annotations: Add vertical reference lines or manual notes for Dashain/Tihar — traffic patterns shift dramatically
- COD/offline conversions: Import offline conversion counts via Sheets if e-commerce
- WhatsApp leads: GA4 event must exist (GTM) or dashboard undercounts real leads
- Low volume sites: Suppress charts that need 100+ sessions to be meaningful; use longer date ranges
Automation: refresh without manual export
Patterns from our automation stack:
| Task | Tool |
|---|---|
| GA4 → Sheets daily export | Apps Script or n8n |
| Meta Ads → Sheets | n8n scheduled workflow |
| Looker refresh | Automatic on source update |
| Slack alert on conversion drop | n8n threshold trigger |
See self-hosted n8n costs vs Zapier for when automation beats manual CSV exports.
Free template sharing strategy (link magnet)
Publishing a sanitized public template copy drives backlinks and agency leads:
- Build master template with demo GA4 property (Google’s sample data works)
- File → Make a copy → Share view link with “Use template” button
- Gate optional: email for PDF setup guide (lead magnet)
- Document data source connection steps in this blog post (you are reading it)
Update template quarterly when GA4 dimensions change — stale templates erode trust.
Common failures (and fixes)
| Problem | Fix |
|---|---|
| “Sample data only” | Reconnect client’s GA4 property with Editor access |
| Conversion count mismatch vs GA4 UI | Check event filter — one marked conversion event only |
| Search Console data delayed | GSC lag is 2–3 days; note in dashboard header |
| Report slow to load | Reduce date range default; limit table row counts |
| Client edits breaks template | Viewer role only; Editor for agency account |
What not to put on dashboards
- Raw session count without conversion context
- 15 pie charts
- Real-time widgets (clients obsess over noise)
- Metrics you cannot explain in one sentence
If a chart does not drive a decision, delete it.
Upgrade path
When clients outgrow Looker Studio:
- BigQuery export (GA4) for unlimited history and SQL
- Looker (enterprise) for modeled data
- Custom React dashboard on their subdomain — only for funded startups
Most Nepali SMEs never need step 2.