Local SEO Ranking Timeline 2026: 12-Month Study & Insights
How Long Does it Take to Rank a Local Business in 2026? A 12-Month SEO Tracking Study
The digital landscape governing local commercial discovery has undergone a profound architectural transformation. As of 2026, the intersection of generative artificial intelligence, zero-tolerance algorithmic verification protocols, and real-world behavioral signals has fundamentally altered the mechanics of search engine optimization (SEO) for local businesses. The historical expectation that a local enterprise could launch a digital presence and achieve dominant market visibility within a matter of weeks is empirically obsolete. The modern algorithmic ecosystem is designed explicitly to filter out transient or manipulative entities, heavily favoring established, operationally verified, and continually engaged businesses. Consequently, achieving sustainable, revenue-driving visibility is no longer an event; it is a meticulously tracked 12-month developmental trajectory.
An exhaustive analysis of multi-regional tracking data, algorithmic documentation, and local search performance metrics reveals a complex continuum of ranking timelines. While an overwhelming 99% of consumers utilize the internet to research local businesses, the mechanism by which search engines deliver those businesses to the consumer is governed by a strict hierarchy of temporal trust. Data consistently demonstrates that a newly initiated local SEO campaign requires a minimum of three to six months to register initial, measurable keyword traction, with the most significant return on investment (ROI) and compounding domain authority materializing between the six and twelve-month marks.
This comprehensive report systematically dismantles the timeline required to rank a local business in the contemporary digital environment. By mapping a precise 12-month tracking continuum, evaluating the updated quantitative ranking factors, and analyzing the profound disruption of AI-assisted search discovery, this analysis establishes the definitive operational blueprint for local search dominance in 2026.
The Economic Paradigm and Investment Architecture of Local SEO
Before dissecting the chronological milestones of search engine ranking, it is necessary to establish the economic and operational commitments required to sustain a 12-month campaign. Search visibility is inherently tethered to capital investment, resource allocation, and sustained human capital. The financial parameters of local optimization in 2026 reflect the maturation of the industry.
Market analysis indicates that professional local SEO packages designed for small to medium-sized enterprises (SMEs) typically range from $300 to $2,000 per month, heavily dependent on the scope of profile optimization, citation management, and content generation. In highly competitive verticals, such as legal services or multi-location home services, specialized agencies report starting retainers of $3,000 to $5,000 per month. Alternatively, a strict do-it-yourself (DIY) approach leveraging software tools demands a minimum cash outlay of approximately $1,068 annually, completely exclusive of the significant temporal cost of 120 internal labor hours per year.
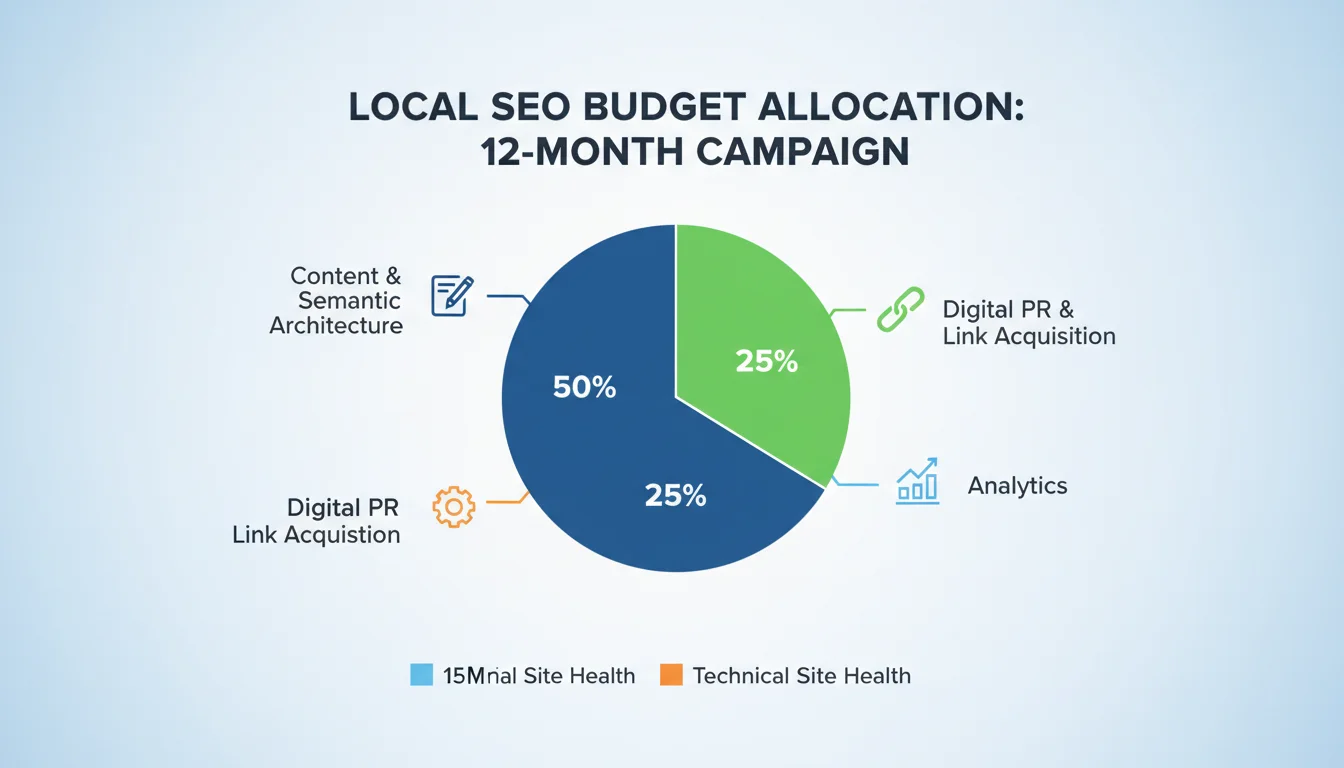
The allocation of these budgets directly dictates the velocity of ranking acquisition. Empirical data suggests an optimal 12-month budget distribution structured as follows: 50% allocated to content creation and semantic architecture, 25% to digital public relations and localized link acquisition, 15% to technical site health and auditing, and 10% to analytics and reporting tools. This precise distribution balances the immediate need for technical compliance with the long-term imperative of compounding topical authority.
The financial data also reveals a direct correlation between campaign longevity and agency revenue generation, which serves as a proxy for client ROI. Tracking the average monthly revenue per client across agency portfolios demonstrates that as campaigns mature past the 12-month threshold, the value derived increases significantly. During the initial 0 to 12 months, the average monthly revenue per client sits at $799. As the campaign crosses into the 1 to 2-year operational window, this figure leaps to $1,349, peaking at $1,569 for clients in the 2 to 3-year bracket. This financial progression mirrors the organic traffic trajectory, proving that businesses which sustain their local search investment for three or more consecutive years generate 2.7 times more local organic traffic than those abandoning efforts within the first year.
-
Client Lifespan Bracket: 0 - 12 Months
Average Monthly Revenue per Client: $799
Strategic Implication: Foundational investment phase; high setup costs with delayed visibility returns.
-
Client Lifespan Bracket: 1 - 2 Years
Average Monthly Revenue per Client: $1,349
Strategic Implication: Inflection point of compounding traffic; initial authority begins yielding lead volume.
-
Client Lifespan Bracket: 2 - 3 Years
Average Monthly Revenue per Client: $1,569
Strategic Implication: Peak optimization efficiency; domain authority allows ranking for highly competitive terms.
-
Client Lifespan Bracket: 3 - 5 Years
Average Monthly Revenue per Client: $1,355
Strategic Implication: Maintenance and defensive optimization; market dominance achieved and sustained.
The overwhelming adoption of AI tools within the small business sector further alters this economic landscape. Current data indicates that 84% of small businesses have integrated artificial intelligence into at least one content or SEO function, a significant leap from 67% in the previous year. The average AI adopter allocates 34% of their total digital marketing budget to these tools, reporting a median 3.8-fold improvement in content output volume without incurring proportional cost increases. Consequently, the barrier to entry for generating high-volume content has evaporated, meaning that search engines no longer reward mere output. Instead, the algorithm aggressively filters for verifiable human experience, localized nuance, and real-world behavioral validation.
The 12-Month Chronological Tracking Trajectory
The expectation of rapid indexing and immediate commercial visibility is a statistical fallacy. An exhaustive evaluation of over two million pages demonstrates that the average age of a web page ranking in the highly coveted number one position on Google is now five years old, representing a dramatic increase from an average of two years old in 2017. Furthermore, only 1.74% of newly published web pages successfully achieve a top-ten ranking position within their first year of existence, a sharp decline from historical averages.
While a small subset of pages—approximately 40.82% of those that eventually reach the top ten—manage to do so within a single month, this rapid ascent is almost exclusively reserved for ultra-low competition, hyper-niche search queries, or domains possessing massive pre-existing authority. For the average local business targeting commercially viable search terms, the journey is protracted. The 12-month timeline can be analytically segmented into four distinct developmental phases, each characterized by specific algorithmic hurdles and requisite optimization tactics.
Phase 1: Architectural Foundations and the Verification Gauntlet (Months 1–2)
The initial sixty days of a local SEO campaign are characterized by intense technical implementation, data normalization, and survival through aggressive algorithmic verification systems. During this period, organic traffic growth is generally stagnant. The primary objective is not traffic acquisition, but the establishment of an impenetrable structural baseline.
The cornerstone of this phase is the establishment of the Google Business Profile (GBP), which serves as the central node of the local search ecosystem. However, gaining entry into this ecosystem in 2026 requires navigating a zero-tolerance verification gauntlet. The current algorithmic standard mandates a continuous, unedited video verification process. Business administrators are required to capture identifiable external street signs to provide geo-contextualization, demonstrate permanent exterior storefront signage that is a character-for-character match with the submitted profile name, and provide undeniable proof of management access by physically unlocking entrances and operating point-of-sale equipment on camera. The sequence must conclude with the camera stabilized over physical commercial utility bills, allowing Google’s optical character recognition (OCR) AI to parse and validate the printed entity data. Any disruption in recording or failure to meet these criteria results in immediate algorithmic rejection.
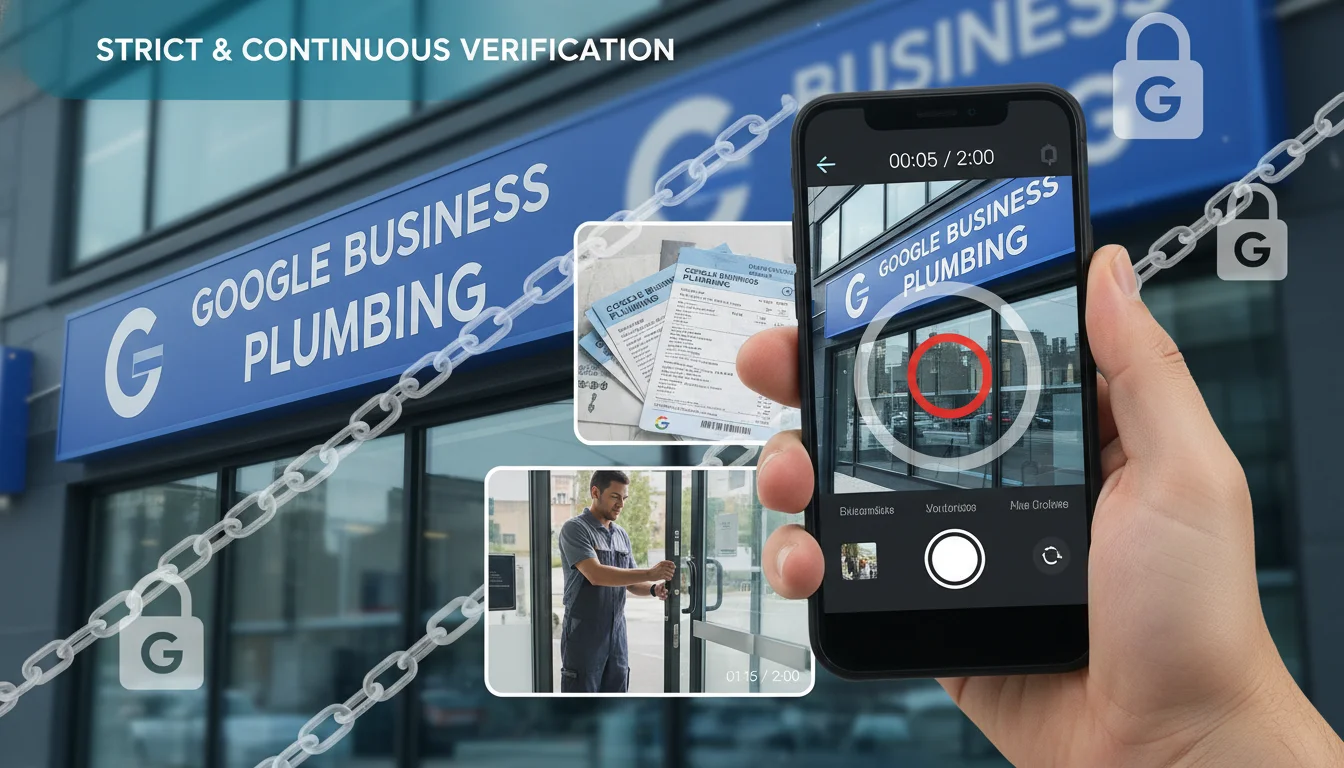
Furthermore, the deployment of stock imagery or digitally altered photos during this phase is catastrophically detrimental.
Google’s Vision AI actively scans uploaded media for artificial manipulation, and the detection of such content frequently results in permanent account termination.
In rare instances, businesses possessing an impeccably structured digital footprint can achieve instant verification via Google Search Console. This algorithmic fast-track requires an exact-match domain name, an impeccably optimized contact page featuring localized schema markup, and pre-existing indexation on highly trusted consumer registries such as the Better Business Bureau or Yelp. When the identical Google account is used to cross-reference the verified Search Console property with the new GBP application, the algorithm occasionally bypasses the video mandate based on overwhelming pre-existing entity confidence.
Upon successful verification, the business enters a critical probationary window governed by the “3-Day Rule” or “NAP Embargo.” Administrators must absolutely refrain from altering the core Name, Address, or Phone Number for a minimum of 72 hours, and ideally up to two weeks. Premature adjustments immediately trigger anomaly detection algorithms, registering as entity instability and frequently resulting in the revocation of verified status.
Concurrently, this phase requires the establishment of cross-platform syndication. Claiming listings on Apple Business Connect and Bing Places is mandatory, as generative AI models rely heavily on these alternative platforms to cross-validate entity data. The website architecture is mapped, creating dedicated, highly granular service pages for every distinct commercial offering, as combining multiple services onto a single page severely dilutes semantic relevance. By the conclusion of Month 2, the business exists as a verified, structurally sound digital entity, ready for algorithmic indexing.
Phase 2: Indexing, AI Digestion, and Behavioral Testing (Months 3–4)
Between the third and fourth months, the search engine actively processes the foundational architecture established in Phase 1. Businesses typically observe the emergence of early keyword impressions and profile discovery views. However, rankings during this window are highly volatile. The algorithm intentionally fluctuates the placement of newly indexed pages to test user reactions, a mechanism designed to measure behavioral validation against the newly claimed relevance.
Within the GBP analytics dashboard, an optimized profile typically begins to generate a baseline of interaction. Statistical averages indicate that a mature, fully completed small business profile receives approximately 1,009 searches per month, comprising 228 direct brand views and 781 categorical discovery views. During Months 3 and 4, businesses should aim to capture a fraction of this potential volume as the algorithm begins to trust the entity.
Crucially, this phase introduces rigorous behavioral testing. The algorithm intensely monitors the Website User Experience (UX) of traffic flowing from the local pack to the primary domain. Because the vast majority of local searches are executed on mobile hardware, technical performance is heavily scrutinized. Websites must achieve a page load speed of under three seconds on mobile networks. If a user clicks a local listing, encounters a sluggish interface, and immediately returns to the search engine results page—a behavioral negative signal known as “pogo-sticking”—the algorithm immediately deprecates the listing’s ranking potential. Conversely, substantial dwell time and deep site navigation confirm to the algorithm that the business successfully satisfied the user’s commercial intent.
Another major developmental hallmark of this phase is the integration of the “Openness” signal. A significant evolution in the 2026 ranking algorithm reveals that the status of “Business is Open at Time of Search” has ascended to become one of the top five ranking determinants for local packs. Search visibility dynamically fluctuates based on real-time operational hours; a business will experience severe ranking deprecation—sometimes beginning up to an hour before its stated closing time—as the algorithm prioritizes competitors that remain open. This necessitates absolute precision in hour management and actively penalizes businesses that fail to update holiday schedules or seasonal closures.
Phase 3: The Prominence Loop, Review Velocity, and Proximity Decay (Months 5–6)
Months five and six represent the critical inflection point of the 12-month timeline. The foundational trust established earlier combines with ongoing operational signals to produce noticeable traffic growth and measurable lead generation. Businesses actively engaging in structured local SEO protocols typically observe a 20% to 50% increase in high-intent actions, such as direct requests for driving directions and click-to-call activations, during this window.
The primary driver of this maturation is the algorithmic evaluation of “Prominence,” which is heavily weighted by the accumulation and velocity of customer reviews. Review dynamics in 2026 have shifted away from raw historical volume toward immediate recency and qualitative sentiment. Data analysis has identified the “Magic 10” threshold; upon securing 10 authentic, text-rich Google reviews, a profile is rewarded with a significant step-function ranking boost. However, the algorithmic benefit of crossing this threshold plateaus almost instantly if review acquisition stalls.
The local ranking algorithm demands velocity. A profile boasting 500 reviews gathered years prior will consistently lose ranking share to a competitor with 50 reviews who demonstrably acquires two new reviews every single week. The steady influx of user-generated feedback acts as a continuous digital heartbeat, proving to the search engine that the business remains highly active, operational, and preferred by the community. When a business ceases to generate reviews, its visibility silently but rapidly erodes.
The psychological architecture of the star rating is equally vital for conversion optimization. Extensive behavioral tracking demonstrates that a 4.5-star average represents the absolute optimal sweet spot for consumer trust. Profiles exhibiting a flawless 5.0-star rating across a significant volume of reviews trigger consumer skepticism, as modern users inherently suspect artificial manipulation or paid feedback. Furthermore, the speed of managerial response is quantified by the algorithm. Businesses that reply to reviews within a 24-hour window maintain an average rating 0.12 points higher than those that ignore feedback, while also sending a potent engagement signal to Google’s evaluation systems.
For service-area businesses (SABs) that dispatch technicians to customer locations, maximizing review velocity during this phase frequently involves operational software integration. By connecting the Google Maps Route Optimization API directly into dispatch logistics, businesses solve the complex “Traveling Salesperson Problem.” The API leverages real-time traffic data, historical travel velocities, and complex logistical matrices—accounting for vehicle capacities and specific customer time windows—to calculate the absolute most efficient routing for a fleet. This algorithmic efficiency allows technicians to service a higher volume of customers per day within their declared two-hour geographic radius. This increased capacity directly accelerates the acquisition of positive customer reviews, which feeds back into the search engine’s Prominence evaluations, creating a self-sustaining loop of operational efficiency and digital dominance.
Phase 4: Compounding Authority, Query Fan-Out, and AI Overviews (Months 6–12+)
The latter half of the 12-month continuum is characterized by the crystallization of domain authority, the stabilization of top-tier rankings, and the profound integration of the business into generative AI search summaries. The optimizations executed in the preceding months compound, allowing the entity to rank for highly lucrative secondary services and hyper-specific long-tail queries without requiring individual, page-by-page optimization.
This phase is heavily defined by the business’s interaction with AI search paradigms. Longitudinal tracking reveals that AI Overviews now trigger for 34.2% of all Google queries globally, a massive escalation from 13.14% in the previous year. Within the local commercial sector specifically, 40.16% of all local business queries trigger these generative summaries. Informational health queries trigger them at a staggering 60.7% rate, while highly transactional ecommerce and real estate queries trigger them less frequently, as users in those sectors demand specific product listings rather than generalized summaries.
The proliferation of AI Overviews has severely impacted traditional click-through rates (CTR). Advanced tracking indicates that top-ranking pages have experienced CTR reductions of up to 42% relative to their historical performance, as users increasingly rely on zero-click summaries to extract phone numbers, operating hours, and service comparisons directly from the search interface.
However, this reduction in top-position CTR does not equate to a reduction in overall search activity. An 18-month longitudinal tracking study evaluating the “Substitution Hypothesis” versus the “Expansion Hypothesis” definitively proved the latter. The data confirms that users utilizing AI tools do not abandon traditional search engines; rather, their information-seeking behavior expands. Users leverage ChatGPT or Gemini for conceptual brainstorming, but immediately return to traditional local search parameters for fact-checking, brand validation, and real-world service procurement.
Furthermore, AI integrations have permanently shattered the traditional monopoly of the top 10 organic results.
A massive data study analyzing over 4 million AI Overview URLs uncovered the mechanism of “query fan-out”. When a user submits a prompt to an AI model, the system does not execute a single search; it dissects the intent into 8 to 16 highly specific sub-queries executed simultaneously. Consequently, only 37.9% of the web pages cited within an AI Overview actually rank in the top 10 of traditional organic search for the head term. The remaining 62% of citations are pulled from pages ranking in positions 11 through 100.
This algorithmic behavior represents a monumental advantage for local challenger brands in the 6 to 12-month phase. A local business website that possesses deep topical expertise and highly structured schema markup, but lacks the brute-force domain authority to outrank national conglomerates for broad keywords, can perfectly answer a niche sub-query. The AI model extracts this hyper-relevant localized data, elevating a page that normally sits in position 45 to the absolute top of the AI-generated summary. Achieving visibility in this “sweet spot” of positions 21 to 100 relies heavily on earning prominence on industry-relevant domains and securing presence on expert-curated “Best Of” local lists, which serve as the definitive truth vectors for AI models.
The 2026 Quantitative Hierarchy of Algorithmic Ranking Factors
Understanding the 12-month trajectory requires a granular breakdown of the specific mathematical weightings applied by the algorithm. The 2026 Local Search Ranking Factors report, synthesized from the evaluations of elite industry experts analyzing 187 distinct variables, defines the exact architecture of modern search visibility.
The data confirms a structural division between how search engines evaluate the Local Pack (the map interface) versus traditional Local Organic links.
Local Pack and Map Visibility Factors
The Map Pack is overwhelmingly governed by the Google Business Profile and customer reputation.
- Google Business Profile Signals (32% Impact): The precise configuration of the GBP is the single largest determinant of map visibility. The primary GBP category selected carries massive weight, followed by the inclusion of highly relevant keywords organically present in the business’s legal title. While keyword stuffing is a punishable offense, businesses with descriptive, keyword-rich legal names maintain a severe algorithmic advantage.
- Review Signals (20% Impact): An increase from 16% in previous years, reviews now dictate a fifth of the total ranking algorithm. This metric evaluates numerical ratings (the 4.5-star ideal), textual sentiment, and the steady velocity of acquisition.
- On-Page Signals (15% Impact): The localization of the connected website landing page ensures semantic relevance to the map pin.
- Behavioral Signals (9% Impact): The algorithm tracks real-world interactions, including mobile click-to-call frequency and driving direction requests, treating them as irrefutable votes of commercial intent.
- Link Signals (8% Impact): The power of traditional backlinks specifically for Map Pack ranking continues to decline.
Traditional Local Organic Search Factors
Conversely, securing a position in the standard organic blue links relies heavily on classical web architecture and off-site authority.
- On-Page Signals (33% Impact): The creation of deeply comprehensive, dedicated pages for each individual service is the number one organic ranking factor. Furthermore, the geographic relevance of the content—embedding specific city names, neighborhoods, and regional landmarks within title tags and header architecture—is mandatory.
- Link Signals (24% Impact): Unlike the Map Pack, organic rankings still demand a robust backlink profile. The quality, authority, and topical relevance of inbound links dictate nearly a quarter of organic success.
- Behavioral Signals (10% Impact): Dwell time and low bounce rates signify content quality to the algorithm.
The AI Search Visibility Matrix
The 2026 algorithmic research introduces a third, entirely distinct evaluation matrix: AI Search Visibility. This framework determines whether a local business is cited by Gemini, ChatGPT, or Google’s AI Overviews.
- On-Page Optimization (24% Impact): The website must feature a scannable, logical structure that allows natural language processors to extract facts instantly.
- Review Sentiment (16% Impact): AI models do not merely count stars; they ingest the semantic narrative of the review text to understand context.
- Citation and Link Parity (13% Impact each): While traditional directory citations have plummeted to a 6% impact for standard map rankings, their importance doubles to 13% for AI visibility. AI relies heavily on “unstructured citations”—mentions of the business in newspaper articles, government portals, and local blogs, regardless of whether a hyperlink is present—to establish entity verification and prominence across the broader web.
| Factor Group | Weight: Map Pack | Weight: Local Organic | Weight: AI Search Visibility |
|---|---|---|---|
| Google Business Profile | 32% | 7% | 12% |
| Review Signals | 20% | 6% | 16% |
| On-Page Optimization | 15% | 33% | 24% |
| Link Acquisition | 8% | 24% | 13% |
| Behavioral Metrics | 9% | 10% | <8% |
| Citations (Structured & Unstructured) | 6% | 7% | 13% |
Negative Ranking Factors and Algorithmic Penalties
The timeline to rank is frequently derailed by algorithmic infractions. The analysis identifies specific triggers that dramatically reduce visibility or invite manual suspension. The single most destructive signal is a business being marked as “Permanently Closed”. This is followed closely by the selection of an incorrect primary GBP category.
The “Filter” remains a potent obstacle, heavily penalizing profiles that share identical categories and physical addresses without distinct operational separation. Furthermore, the algorithm actively targets “Business Name Stuffing.” Profiles that inject locational modifiers or service keywords into their name that are absent from their commercial lease or exterior signage are subjected to aggressive suspension sweeps. Interestingly, widespread industry testing has debunked the necessity of strict 60-character limits for title tags; search engines do not penalize length, and utilizing extra descriptive terms can improve ranking associations even if the display result is truncated.
The intersection of physical and digital marketing has also evolved. Real-world behavioral signals are now potent ranking drivers. The deployment of physical flyers, exterior signage, and service fleet vehicles equipped with tracking QR codes bridges the offline-to-online gap. When these offline interactions generate direct branded searches or localized referral traffic, the algorithm registers a massive spike in real-world brand prominence, validating the entity far more effectively than traditional digital link building. Furthermore, specific content types perform exceptionally well in local contexts; research indicates that infographics drive significantly more direct image traffic for small businesses than standard photography or stock images.
For businesses participating in Local Services Ads (LSAs), the ranking parameters are distinctly separate from organic algorithms. LSA placement is dictated entirely by Budget and Bidding strategies, Review metrics (specifically volume, average rating, and recency), the precision of Service Selection, and, critically, the speed of managerial Response Times to incoming inquiries.
Empirical Validations: 12-Month Case Study Trajectories
The theoretical milestones and algorithmic weightings detailed above are empirically validated by extensive tracking data from executed local SEO campaigns analyzed throughout the 2025-2026 window. These longitudinal studies isolate the compounding nature of technical optimization, content architecture, and behavioral signals.
In the healthcare sector, the Northeast Medical Group, a network comprising over 130 practice locations, executed an aggressive strategy focused on demonstrating high-level medical E-E-A-T (Expertise, Experience, Authority, and Trustworthiness) by answering specific, high-volume patient questions. Over a 12-month tracking period, the group’s localized organic traffic escalated from 41,200 to 410,300 monthly visits, representing an exceptional 893% year-over-year increase. A singular, highly authoritative article regarding blood sugar ranges grew to generate over 250,000 monthly visits, while specific optimizations for generative AI models allowed the network to capture an additional 8,300 visits per month exclusively from Google AI Overviews.
In the regional tourism sector, Visit Atlantic City underwent a massive digital consolidation. By leveraging 301 redirects to fuse multiple niche websites into a single authoritative domain, and rigorously optimizing localized “Things to Do” hub pages, the organization achieved a 661% year-over-year surge in organic traffic, scaling from 17,300 to 141,200 monthly visits. Their localized architecture successfully captured 2,400 keyword rankings within the highly visual Google Image Pack, demonstrating the value of multi-surface visibility.
The retail and ecommerce space provides further validation of compounding returns. The regional florist delivery service Bloom & Wild generated a 472% year-over-year traffic increase, ultimately securing 3.5 million monthly visits and ranking for over half a million keywords. This was achieved by aggressively targeting top-of-funnel local search queries and information-seeking intent regarding flower care, effectively capturing audiences prior to their commercial decision phase. Similarly, Hawthorn, a local brick-and-mortar shopping center, expanded its digital footprint by launching an integrated ecommerce platform.
By algorithmically optimizing and deploying 51,000 new locational and product pages, the mall tripled its total keyword rankings to 326,000, reaching 252,000 monthly visits within a mere five-month window.
Entity Profile
Northeast Medical Group
Industry Sector: Regional Healthcare
YoY Organic Growth: +893%
Primary Strategic Catalyst: E-E-A-T medical content, AI Overview optimization.
Visit Atlantic City
Industry Sector: Local Tourism
YoY Organic Growth: +661%
Primary Strategic Catalyst: Domain consolidation, localized topical hub pages.
Bloom & Wild
Industry Sector: Regional Retail
YoY Organic Growth: +472%
Primary Strategic Catalyst: Top-of-funnel informational blog architecture.
Hawthorn Mall
Industry Sector: Local Brick & Mortar
YoY Organic Growth: Massive Scaling
Primary Strategic Catalyst: Large-scale locational and product page deployment.
These case studies conclusively demonstrate that while the initial architecture phase of a local SEO campaign may appear stagnant from a traffic perspective, the algorithmic trust established in the first few months serves as the launchpad for geometric expansion in the back half of the 12-month cycle.
Conclusion
The proposition of ranking a local business in the 2026 search ecosystem requires a fundamental recalibration of commercial expectations. The empirical data derived from 12-month tracking studies, algorithmic documentation, and financial performance metrics conclusively demonstrates that local SEO is not a short-term marketing intervention, but rather the architectural construction of a highly verified, algorithmically trusted digital entity.
A standard campaign demands three to six months of foundational execution. This initial period is dominated by navigating strict video verification protocols, establishing technical website structuring, syncing data across the “Big 12” data aggregators and AI-reliant platforms, and generating initial review velocity. Meaningful commercial traction—manifesting as direction requests and click-to-call interactions—only emerges as the search engine’s temporal filters are satisfied and the entity proves its operational reality.
It is within the six to twelve-month phase that compounding returns materialize. The convergence of localized links, unstructured citations, and sustained review sentiment triggers top-tier placement in the Map Pack, traditional organic search, and highly visible generative AI Overviews. The algorithmic transition away from manipulatable directory submissions toward real-world behavioral signals, entity confidence, and conversational AI discovery means that businesses must operate genuinely exceptional real-world operations to sustain digital visibility. The local businesses that secure dominant market share in 2026 are those that view local search optimization not as an isolated marketing expense, but as a sustained, multi-year commitment to structural integrity, community integration, and unquestionable algorithmic trust.