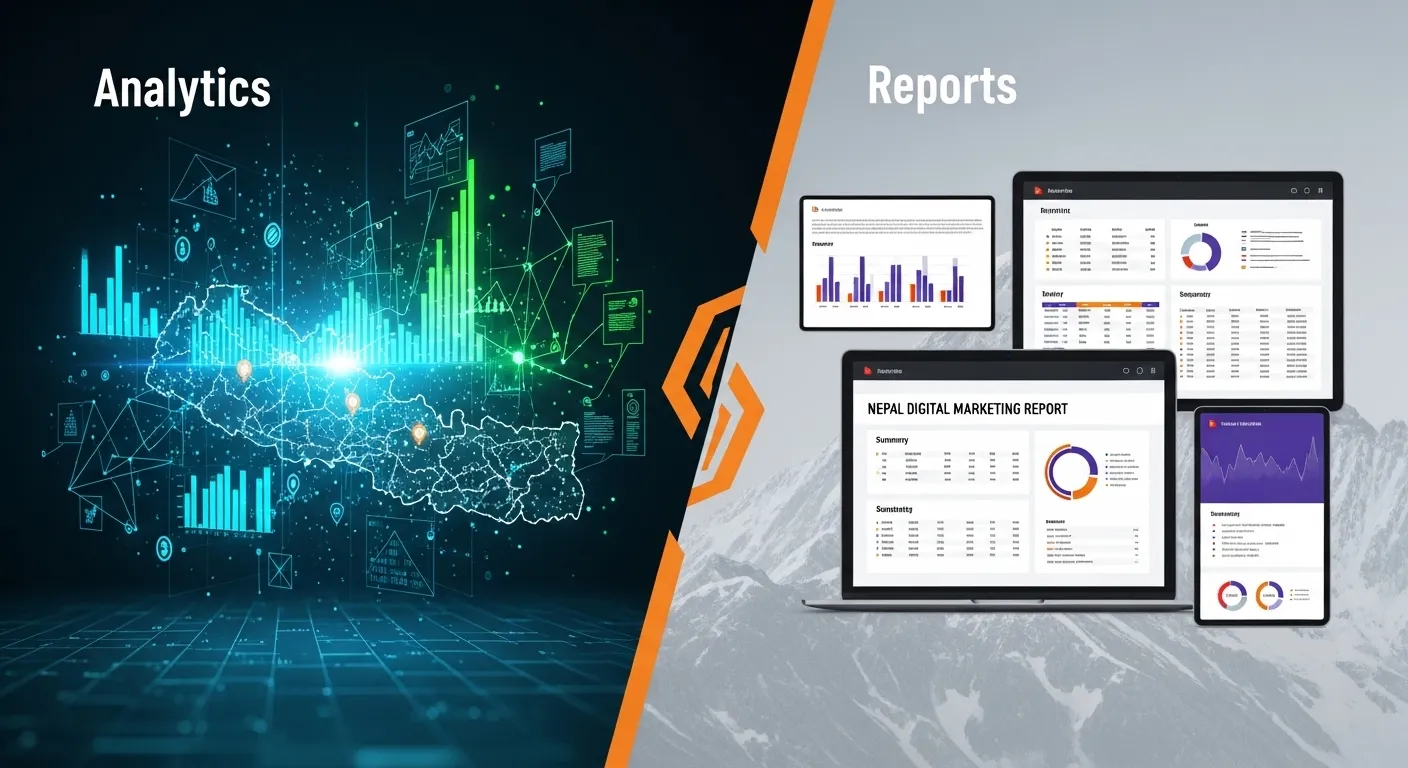
Analytics vs. Reports for Digital Marketing in Nepal: A Clear Distinction
In the rapidly evolving digital landscape of Nepal, businesses are increasingly relying on data to guide their strategies. However, a common point of confusion arises when discussing analytics vs. reports. While often used interchangeably, these two terms represent distinct processes that serve different, yet equally vital, purposes in your digital marketing Nepal strategy.
As a digital marketing professional, I frequently encounter businesses that diligently generate reports but struggle to extract meaningful actionable insights. This post aims to clarify the fundamental difference, empowering Nepali businesses to move beyond mere data presentation to true data analysis and informed decision-making.
Reports: The Snapshot of “What Happened” in Digital Marketing
Reports are essentially organized summaries of data. They provide a snapshot of past or current performance, answering the question: “What happened?” Think of a report as a historical record or a status update.
Key Characteristics of Reports:
- Focus: Descriptive. They tell you the facts and figures.
- Nature: Static. Once generated, they don’t change unless manually updated or a new report is created.
- Purpose: To monitor performance, track trends over time, and provide a consistent view of data to stakeholders.
- Examples: A monthly website traffic report, a weekly sales summary, a quarterly social media engagement report.
- Tools: Standard dashboards in Google Analytics, Google Search Console, social media platforms, or simple spreadsheets.
Why Reports are Important for Nepali Businesses in Digital Marketing:
Reports are crucial for accountability and tracking progress. They help you see if your marketing efforts are moving the needle on key metrics like website visitors, conversion rates, or ad spend. Without reports, you wouldn’t have a baseline to measure against.
Analytics: The Deep Dive into “Why” and “What Next” in Digital Marketing in Nepal
Analytics goes beyond simply presenting data. It involves a deeper investigation into why certain things happened and what you should do about it. It seeks to uncover patterns, correlations, and root causes, providing actionable insights and often predicting future outcomes.
Key Characteristics of Analytics:
- Focus: Diagnostic, predictive, prescriptive. They explain the why and suggest the what next.
- Nature: Dynamic and interactive. Analysts can slice and dice data, drill down into specifics, and explore different scenarios.
- Purpose: To understand underlying causes, identify opportunities for optimization, solve problems, and make strategic recommendations.
- Examples: Analyzing why a specific product page has a high bounce rate, identifying which customer segments are most profitable, predicting future sales based on past trends, or determining the optimal budget allocation for an upcoming campaign.
- Tools: Advanced features in Google Analytics (Explorations, custom segments), A/B testing platforms, data visualization tools (e.g., Looker Studio, Tableau), and statistical software.
Why Analytics is Important for Nepali Businesses in Digital Marketing:
Analytics is what drives true growth and competitive advantage. It helps you understand the nuances of your market, the behavior of your Nepali audience, and the effectiveness of your strategies. It transforms raw data into intelligence that can be used to refine campaigns, improve user experience, and ultimately, increase profitability.
The Symbiotic Relationship in Digital Marketing
Reports and analytics are not in opposition; they are symbiotic. You need reliable reports to provide the raw data, and you need robust analytics to make sense of that data and turn it into strategic action.
- Reports feed Analytics: Reports provide the foundational data that analysts then use for deeper investigation.
- Analytics informs Strategy: The insights gained from analytics then inform future marketing strategies and business decisions, which are then monitored through new reports.
For any Nepali business aiming for sustainable growth, embracing both accurate data reporting and insightful data analysis is essential. It allows you to move from simply observing your digital performance to actively shaping it.
graph TD
    A[Raw Data] --> B("Reports: What Happened?");
    B --> C{"Analytics: Why & What Next?"};
    C -- Insights & Recommendations --> D["Strategy & Decisions"];
    D -- New Actions & Campaigns --> A;
    style A fill:#f9f,stroke:#333,stroke-width:2px
    style B fill:#bbf,stroke:#333,stroke-width:2px
    style C fill:#ccf,stroke:#333,stroke-width:2px
    style D fill:#fbf,stroke:#333,stroke-width:2px
Figure 1: The Symbiotic Relationship between Reports and Analytics
Practical Examples: Reports vs. Analytics in Action
Let’s look at concrete examples to understand the difference in a Nepal business context:
Example 1: E-commerce Store in Kathmandu
Report Says:
- Website traffic: 15,000 visits last month
- Bounce rate: 68%
- Average session duration: 1 minute 32 seconds
- 127 transactions, NPR 485,000 revenue
Analytics Reveals:
- Why: Mobile bounce rate is 82% vs. desktop 41% → Mobile site has loading issues
- Why: Most bounces happen on product pages with images over 2MB
- Why: 73% of traffic comes from Facebook, but Facebook traffic converts at only 0.4% vs. Google organic at 3.2%
- What next: Optimize mobile images, shift budget from Facebook to Google, fix slow-loading product pages
- Predicted impact: 35-40% increase in conversions, NPR 650,000+ projected revenue
Example 2: Digital Marketing Agency in Pokhara
Report Says:
- Lead generation form submissions: 23 this month
- Cost per lead: NPR 1,450
- Traffic sources: 40% social, 35% organic, 25% paid
Analytics Reveals:
- Why: 61% of leads come from one blog post about “local SEO in Nepal”
- Why: Social traffic has 8% conversion rate, but organic search has 0.9%
- Why: Leads from Google Ads convert to clients at 12% vs. Facebook leads at 2%
- What next: Create 5 more blog posts like the top performer, reallocate budget from Facebook to Google Ads, improve Facebook ad targeting
- Predicted impact: Double lead quality, reduce cost per qualified lead by 40%
Example 3: Hotel in Kathmandu
Report Says:
- Booking inquiries: 87
- Website traffic: 6,200 visits
- Top referrer: Booking.com
- Email list: 1,240 subscribers
Analytics Reveals:
- Why: Direct bookings cost NPR 180 per booking vs. NPR 4,200 through OTAs (23x cheaper)
- Why: Email subscribers book 4.3x more than non-subscribers
- Why: Mobile traffic converts 2.1x better than desktop (people book while traveling)
- What next: Aggressive email collection campaign, mobile-first booking process, offer 15% discount for direct bookings to compete with OTAs
- Predicted impact: 60% increase in direct bookings, saving NPR 12-15 lakh annually in OTA commissions
The Data Maturity Ladder: Where Is Your Nepal Business?
Understanding where your business falls on the data maturity spectrum helps you know what to focus on next:
Level 1: Data Illiteracy (20% of Nepal businesses)
Characteristics:
- No analytics tools installed
- Decisions based purely on gut feeling
- No tracking of any digital metrics
- “I think it’s working” is the measurement strategy
What you need:
- Install Google Analytics 4 (free)
- Set up Facebook Pixel
- Create basic monthly reports
- Track website visitors, leads, sales
Resources: Start with our Google Analytics setup guide.
Level 2: Basic Reporting (50% of Nepal businesses)
Characteristics:
- Google Analytics installed
- Look at dashboard occasionally
- Generate monthly traffic reports
- Know visitor numbers but not much else
What you need:
- Set up conversion tracking (leads, sales, calls)
- Create custom reports for your KPIs
- Understand basic metrics (bounce rate, session duration, conversion rate)
- Move beyond vanity metrics
Resources: Our essential metrics guide.
Level 3: Data-Informed (25% of Nepal businesses)
Characteristics:
- Regular reporting process
- Multiple team members access data
- Track conversions and ROI
- Make some decisions based on data
What you need:
- Start asking “why” questions
- Segment analysis by traffic source, device, location
- Create attribution models
- A/B test changes
- Combine data from multiple sources
Resources: Learn data-driven decision making.
Level 4: Data-Driven (4% of Nepal businesses)
Characteristics:
- Analytics integrated into all decisions
- Predictive modeling for forecasting
- Advanced segmentation and cohort analysis
- Automated reporting dashboards
- Cross-functional data sharing
What you need:
- Advanced analytics platform (beyond free GA4)
- Data analyst or agency partnership
- Marketing automation integration
- Custom dashboards for stakeholders
- Machine learning for predictions
Resources: Explore advanced analytics strategies.
Level 5: Data Leadership (1% of Nepal businesses)
Characteristics:
- Data science team or partnership
- Real-time decision making
- AI/ML powered personalization
- Competitive intelligence systems
- Data as core competitive advantage
What you need:
- Chief Data Officer or equivalent
- Enterprise analytics stack
- Data warehouse and business intelligence tools
- Continuous experimentation culture
- Customer data platform (CDP)
Goal for Most Nepal Businesses: Level 3 (Data-Informed) is realistic and sufficient for significant growth. Level 4 is the long-term aspiration for serious enterprises.
Essential Analytics Skills for Nepal Marketers
To truly leverage analytics (not just reports), you need to develop these competencies:
1. Statistical Thinking
What it means: Understanding correlation vs. causation, statistical significance, sample sizes.
Nepal example:
- ❌ Poor thinking: “We sent an email on Dashain and sales went up 40%, so emails work great!”
- ✅ Good thinking: “We sent an email on Dashain. Sales usually increase 35% during Dashain anyway. After controlling for seasonality, the email contributed an additional 5% lift, which is good but not spectacular.”
Why it matters: Prevents false conclusions and wasted budget on things that don’t actually work.
2. Segmentation Mastery
What it means: Ability to break down data by meaningful groups to find insights.
Useful segments for Nepal:
- Geographic: Kathmandu Valley vs. Pokhara vs. Terai vs. Mountain regions
- Device: Mobile (Android/iOS) vs. Desktop vs. Tablet
- Traffic source: Organic vs. Paid vs. Social vs. Direct vs. Referral
- Customer type: New vs. Returning vs. VIP
- Language preference: English vs. Nepali vs. Mixed
- Time-based: Weekday vs. Weekend, Morning vs. Evening
- Festival season: Dashain vs. Tihar vs. Regular periods
Nepal example: Instead of seeing “conversion rate: 2.3%”, segment and discover:
- Mobile iOS users from Kathmandu: 8.7% conversion rate
- Mobile Android users from Terai: 1.1% conversion rate
- Now you know where to focus optimization efforts!
3. Funnel Analysis
What it means: Understanding the customer journey from first touch to conversion and identifying where people drop off.
Typical Nepal E-commerce Funnel:
Step 1: Homepage visit → 10,000 users (100%)
Step 2: Product page view → 4,200 users (42%) ← 58% drop off
Step 3: Add to cart → 840 users (8.4%) ← 80% drop off
Step 4: Checkout started → 294 users (2.9%) ← 65% drop off
Step 5: Payment completed → 168 users (1.68%) ← 43% drop off
Analytics approach:
- Why do 58% leave after homepage? (Poor navigation? Slow loading?)
- Why do 80% not add to cart? (Price? Trust? Information?)
- Why do 65% abandon at checkout? (Shipping cost? Form length?)
- Why do 43% abandon at payment? (Payment options? Trust signals?)
graph TD
    A["Homepage Visit: 10,000 users (100%)"] --> B{"Product Page View: 4,200 users (42%)"};
    B -- 58% Drop Off --> C{"Add to Cart: 840 users (8.4%)"};
    C -- 80% Drop Off --> D{"Checkout Started: 294 users (2.9%)"};
    D -- 65% Drop Off --> E["Payment Completed: 168 users (1.68%)"];
    style A fill:#dff,stroke:#333,stroke-width:2px
    style B fill:#ccf,stroke:#333,stroke-width:2px
    style C fill:#bbf,stroke:#333,stroke-width:2px
    style D fill:#aae,stroke:#333,stroke-width:2px
    style E fill:#99d,stroke:#333,stroke-width:2px
Figure 2: Typical Nepal E-commerce Conversion Funnel
Fix the biggest leak first for maximum impact.
Learn more about conversion optimization in Nepal.
4. Attribution Understanding
What it means: Knowing which marketing touchpoints deserve credit for conversions.
Nepal customer journey example:
Day 1: User sees Facebook ad → clicks → browses, doesn't buy
Day 3: User searches "best laptops Nepal" → clicks organic result → compares options
Day 5: User clicks Google Ad → adds to cart, abandons
Day 7: User receives cart abandonment email → clicks → completes purchase
Questions:
- Which channel gets credit? Facebook? Organic? Google Ads? Email?
- Last-click attribution: Email gets 100% credit (misleading!)
- First-click attribution: Facebook gets 100% credit (also misleading!)
- Data-driven attribution: Credits each touchpoint appropriately
Why it matters: Prevents killing marketing channels that assist conversions even if they don’t get the final click.
5. Cohort Analysis
What it means: Tracking groups of users who share a common characteristic over time.
Nepal example - Customer retention by acquisition month:
Jan 2025 cohort: 100 customers acquired
- Month 1: 100 active (100%)
- Month 2: 73 active (73%)
- Month 3: 51 active (51%)
- Month 6: 34 active (34%)

Feb 2025 cohort: 120 customers acquired (after optimizing onboarding)
- Month 1: 120 active (100%)
- Month 2: 102 active (85%) ← Better retention!
- Month 3: 87 active (72.5%) ← Much better!
- Month 6: TBD (tracking in progress)
Insight: The February onboarding improvements increased 3-month retention by 21.5 percentage points, proving the investment was worthwhile.
Common Analytics Mistakes in Nepal
Avoid these pitfalls when moving from reports to analytics:
Mistake 1: Analysis Paralysis
Problem: Spending so much time analyzing data that you never take action.
Nepal example: Spending 3 weeks creating the “perfect” dashboard while competitors are testing and learning.
Solution:
- Follow the 80/20 rule: Quick analysis + action beats perfect analysis + delays
- Set time limits for analysis (maximum 2-3 hours for most decisions)
- Use “good enough” data to make informed guesses, then validate
Mistake 2: Ignoring Context
Problem: Looking at numbers without considering external factors.
Nepal examples:
- Traffic drops 40% → panic! → But it’s during Dashain when people are traveling
- Conversion rate spikes → celebrate! → But you forgot you ran a 50% off sale
- Lead quality drops → blame marketing! → But economy is struggling nationwide
Solution:
- Always add context to your analysis
- Create a business calendar noting festivals, campaigns, external events
- Compare year-over-year, not just month-over-month
- Ask “what else was happening?” before drawing conclusions
Mistake 3: Confusing Vanity Metrics with KPIs
Vanity metrics look good but don’t drive business:
- Total website visitors
- Social media followers
- Email list size
- Page views
Real KPIs that matter:
- Cost per acquisition (CPA)
- Customer lifetime value (CLV)
- Conversion rate
- Revenue per visitor
- Return on ad spend (ROAS)
- Customer retention rate
Nepal example:
- Report: “We got 50,000 Instagram followers!”
- Analytics: “Those followers engage at 0.2% and generate zero sales. Our 2,500 email subscribers generate 40% of our revenue. We should invest more in email and less in Instagram.”
Mistake 4: Not Connecting Digital to Business Outcomes
Problem: Tracking online metrics without linking to actual business results.
Nepal example:
- Report: “Website conversion rate improved from 2% to 3.5%”
- Missing context: But average order value dropped from NPR 2,500 to NPR 800, so total revenue actually decreased
Solution:
- Always connect digital metrics to revenue, profit, customer lifetime value
- Create a metrics hierarchy pyramid:
- Top: Business outcomes (revenue, profit, market share)
- Middle: Business KPIs (conversion rate, average order value, customer retention)
- Bottom: Activity metrics (traffic, clicks, opens)
Mistake 5: Trusting Data Blindly
Problem: Not validating if your tracking is working correctly.
Common Nepal tracking issues:
- Google Analytics not filtering out internal office traffic
- Conversions tracked multiple times (double-counting)
- Form submissions not tracked at all
- E-commerce transactions missing tax/shipping
- Cross-domain tracking broken (e.g., website to payment gateway)
Solution:
- Audit your tracking quarterly
- Test form submissions yourself and verify they appear in analytics
- Compare analytics numbers to actual business records
- Set up data quality alerts for anomalies
Learn how to avoid analytics failures.
Building an Analytics-First Culture in Your Nepal Business
Reports are passive. Analytics requires active inquiry. Here’s how to build that culture:
1. Start Meetings with Data
Before: “I think our Facebook ads are working well.”
After: “Our Facebook ads generated 47 leads last month at NPR 850 per lead, but only 2 converted to sales. Google Ads generated 31 leads at NPR 1,200 per lead, but 9 converted to sales. We should shift budget to Google.”
Practice:
- Every marketing meeting starts with key metrics review
- Every campaign proposal includes expected ROI
- Every post-campaign review analyzes what worked and why
2. Create a “Why” Chain
Train your team to ask “why” five times:
Example:
- Conversion rate dropped from 3% to 2.1% → Why?
- Mobile conversion rate dropped to 1.4% → Why?
- Android users specifically dropped to 0.9% → Why?
- After latest app update, checkout button not visible on some Android devices → Why?
- Testing team didn’t test on older Android versions still popular in Nepal → Root cause found!
3. Democratize Data Access
What works in Nepal:
- Give all team members view-only access to Google Analytics
- Create simple, visual dashboards for non-technical staff
- Train everyone on basic metrics interpretation
- Share weekly “data stories” (1-2 insights with context)
- Celebrate data-driven wins publicly
What doesn’t work:
- Keeping data locked with IT/Marketing departments only
- Sharing raw spreadsheets without interpretation
- Assuming everyone understands technical metrics
- No training on how to use tools
4. Test Everything
Build a culture of experimentation:
Monthly testing calendar for Nepal businesses:
- Week 1: Test new ad creative or landing page headline
- Week 2: Test different call-to-action wording or button color
- Week 3: Test email subject lines or send times
- Week 4: Analyze results, implement winners, plan next tests
Nepal-specific tests:
- English vs. Nepali vs. mixed language
- International stock photos vs. local Nepal imagery
- Formal vs. conversational tone
- Different festival-themed promotions
- Payme options (credit card vs. cash on delivery vs. digital wallets)
5. Document Learnings
Create a shared “Insights Library”:
Format:
- Date: When was this discovered?
- Insight: What did we learn?
- Data: What proof do we have?
- Action taken: What did we change?
- Result: What was the impact?
- Applies to: Which campaigns/channels does this affect?
Nepal Example Entry:
Date: March 15, 2025
Insight: Adding "Cash on Delivery Available" in ad headlines increases CTR by 34%
Data: A/B test over 2 weeks, 2,847 impressions, statistically significant
Action: Updated all e-commerce ads to mention CoD
Result: CTR improved from 3.1% to 4.2%, CPA reduced from NPR 980 to NPR 740
Applies to: All e-commerce campaigns targeting Nepal
Tools for Analytics (Beyond Basic Reporting)
While Google Analytics handles reporting well, these tools enable deeper analytics:
Free Tools for Nepal Businesses:
Google Analytics 4 (free)
- Best for: Website traffic analysis, conversion tracking, user behavior
- Advanced features: Predictive metrics, custom explorations, audience building
- Nepal tip: Set up separate property for Nepali language vs. English visitors
Google Search Console (free)
- Best for: SEO performance, search queries, indexing issues
- Analytics use: Find which keywords drive conversions, not just clicks
- Nepal tip: Track “Nepal” vs. “Nepali” vs. “Kathmandu” keyword performance separately
Facebook/Instagram Insights (free)
- Best for: Social media performance, audience demographics
- Analytics use: Find which content types drive real engagement vs. vanity metrics
- Nepal tip: Compare Kathmandu vs. other regions, identify best-performing post times
Hotjar (free plan available)
- Best for: Heatmaps, session recordings, user feedback
- Analytics use: See exactly where users click, how far they scroll, where they get confused
- Nepal tip: Identify if mobile users struggle with specific elements
Paid Tools for Growing Nepal Businesses:
Google Looker Studio (formerly Data Studio) - Free, but premium templates available
- Best for: Creating automated, visual dashboards pulling from multiple sources
- Use case: Combine Google Analytics, Google Ads, Facebook Ads, and sales data in one view
- Price: Free for basic, ~$50/month for advanced features
Mixpanel (~$25/month and up)
- Best for: Product analytics, user journey tracking
- Use case: SaaS businesses, mobile apps wanting detailed user behavior insights
- Nepal applicability: Good for tech startups
Hotjar (paid plans $39/month+)
- Best for: User experience optimization
- Use case: E-commerce wanting to understand why users abandon carts
- Nepal applicability: High-value if you have decent traffic (>1,000 visitors/day)
SEMrush or Ahrefs ($99-399/month)
- Best for: SEO and competitor analytics
- Use case: Understanding market share, finding content opportunities
- Nepal applicability: Worth it for agencies or businesses serious about dominating search
For Most Nepal Businesses:
Start with the free stack (GA4 + Google Search Console + Social insights). Only invest in paid tools once you’re actively using the free ones and have specific needs they don’t fulfill.
Your 90-Day Journey from Reports to Analytics
Here’s a practical roadmap for Nepal businesses to level up:
Month 1: Foundation
Week 1-2: Audit & Setup
- Verify Google Analytics is tracking correctly
- Set up conversion goals (leads, sales, calls)
- Filter out internal traffic (your office)
- Enable demographics and interests reports
- Link Google Ads and Search Console
Week 3-4: Baseline Reporting
- Create 3 monthly reports: Traffic, Conversions, Revenue
- Document current performance (your baseline)
- Identify your top 5 KPIs
- Set realistic improvement targets
Month 2: Analysis Skills
Week 5-6: Segmentation
- Segment traffic by device, source, location
- Identify which segments convert best
- Find your highest-value customer profile
- Discover problem areas (high bounce segments)
Week 7-8: Funnel Mapping
- Map your customer journey (awareness → conversion)
- Identify drop-off points
- Calculate drop-off rates at each stage
- Prioritize biggest opportunity areas
Month 3: Action & Optimization
Week 9-10: Testing
- Design and launch 2 A/B tests
- One targeting biggest funnel leak
- One targeting highest-value segment
- Collect sufficient data (minimum 100 conversions per variation)
Week 11-12: Iteration
- Analyze test results
- Implement winners
- Document learnings in Insights Library
- Plan next round of tests
Success Metrics After 90 Days:
- You make decisions based on data, not gut feeling
- You can explain “why” metrics change, not just “what” changed
- You’ve improved at least one key KPI by 20%+
- Team members regularly reference data in discussions
- You have a clear roadmap of what to test next
Final Thoughts: From Reporting to Strategic Intelligence
In the rapidly evolving Nepali digital marketplace, the businesses that thrive will be those that master the transition from passive reporting to active analytics. This isn’t about having more data—it’s about generating better insights and taking smarter actions.
Remember:
- Reports tell you where you’ve been (rearview mirror)
- Analytics tells you why and where to go next (GPS + forecast)
The Nepal Context: Our market is unique. Strategies from India, US, or Europe need adaptation. The only way to discover what works for your specific Nepali audience is through rigorous, localized analytics. Generic reports won’t cut it.
Your Competitive Advantage: Most Nepali businesses are still stuck at Level 1-2 (basic reporting). By reaching Level 3-4 (data-informed to data-driven), you gain a massive competitive edge. You’ll know what your competitors don’t. You’ll optimize where they guess. You’ll scale what works while they waste budget.
Start Today: Don’t wait for perfect tools or a data scientist. Start with the free analytics stack, ask better questions, and make data-informed decisions now. Every day you wait is a day your competitors might get ahead.
The Path Forward:
- This week: Audit your analytics setup
- This month: Move from just viewing reports to asking “why” and “what next”
- This quarter: Build analytics into your decision-making process
- This year: Make data-driven decisions your competitive advantage
Remember: In Nepal’s increasingly digital marketplace, the businesses that win won’t just be those with the best products or lowest prices. They’ll be the ones that understand their customers best, optimize relentlessly, and make smarter decisions faster. That starts with mastering the difference between reporting and analytics.
Need help making the transition? Our team specializes in analytics implementation and data-driven marketing strategies tailored for Nepal businesses. Get in touch for a free analytics audit.
Additional Resources
Continue Learning:
- Data-Driven Marketing in Nepal
- Google Analytics 4 Setup Guide
- 5 Must-Track Metrics for Nepal Businesses
- From Data to Decisions Framework
- Analytics Case Studies from Nepal
- Common Analytics Failures in Nepal
- GA4 for Conversion Optimization
Tools & Templates:
The future of digital marketing in Nepal belongs to those who can transform data into strategic intelligence. Make sure you’re one of them.
Related Posts and Resources
- Digital Marketing in Nepal (Complete Guide)
- Google Ads in Nepal: Practical Strategy
- SEO Analytics for Nepali Businesses
- eCommerce Analytics Setup in Nepal
- eCommerce Metrics That Matter
- Email Marketing Guide for Nepal
- Email Marketing ROI in Nepal
- Facebook Ads Budget Guide (Nepal)
- Cultural PPC Strategy for Nepal
- Competitor Analysis Framework for Nepal